About me
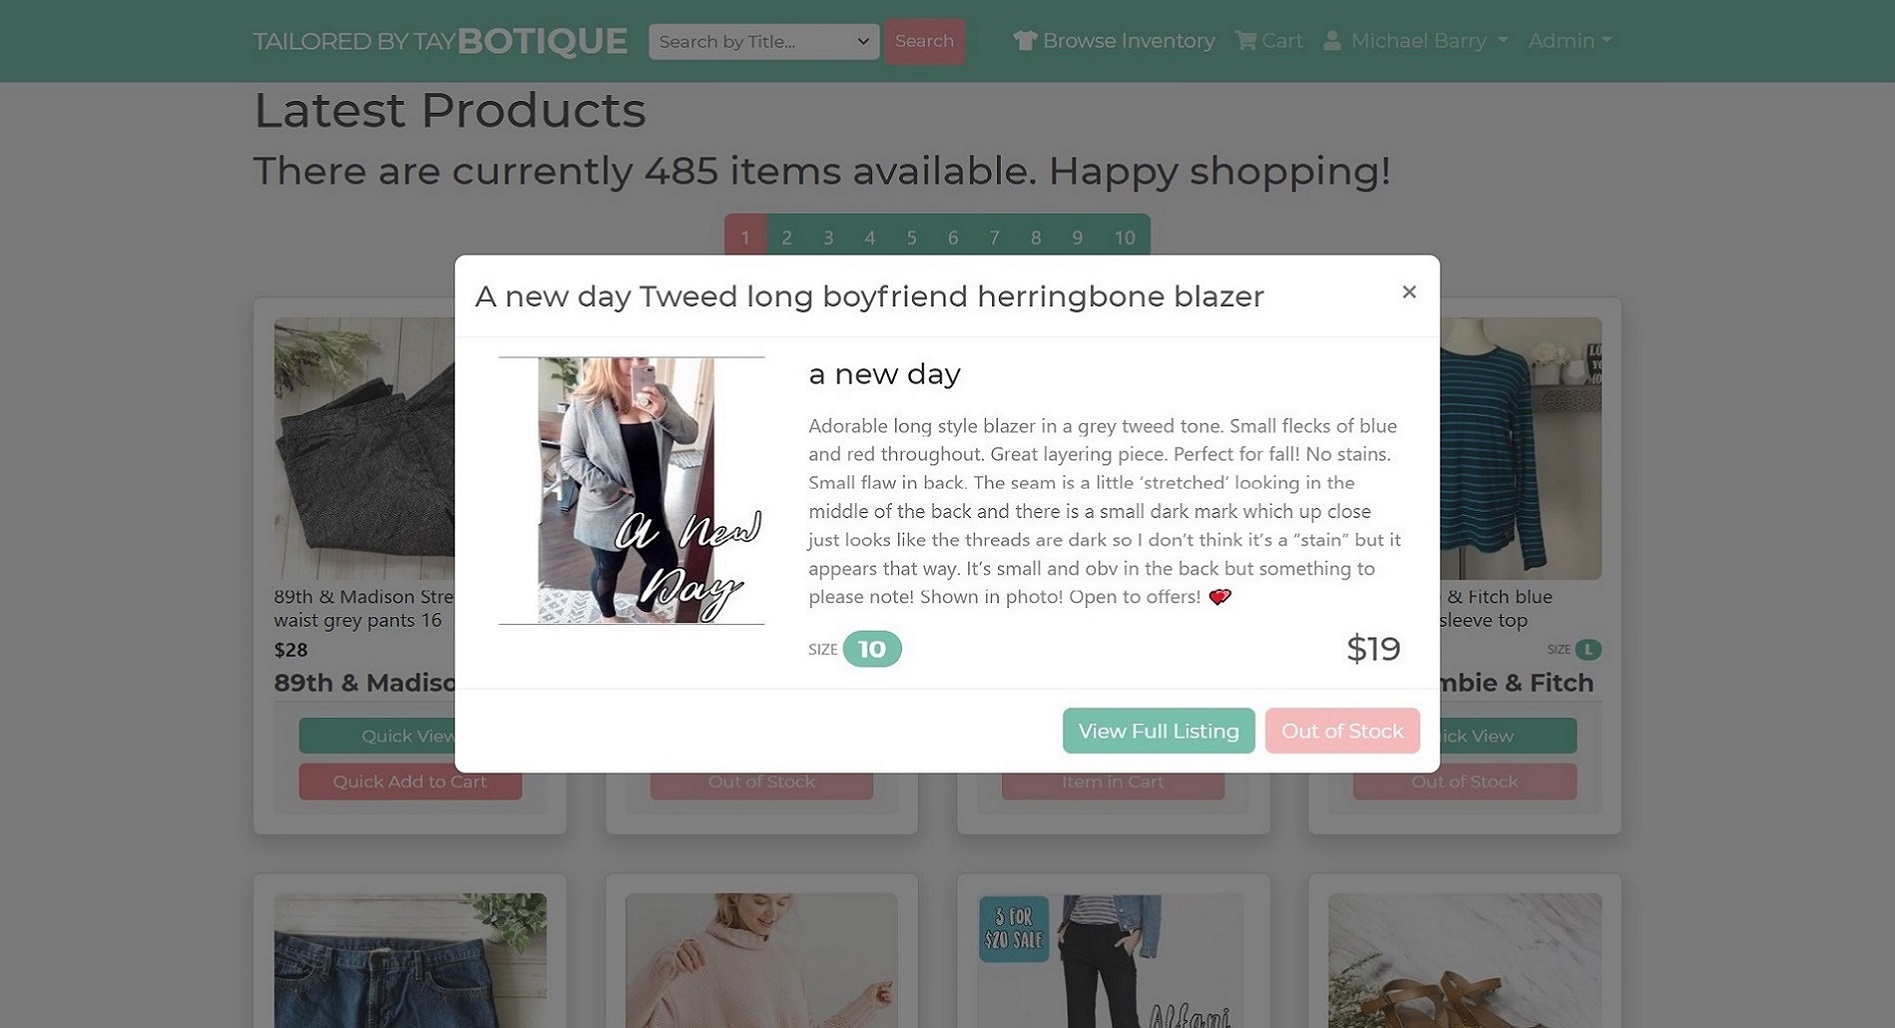
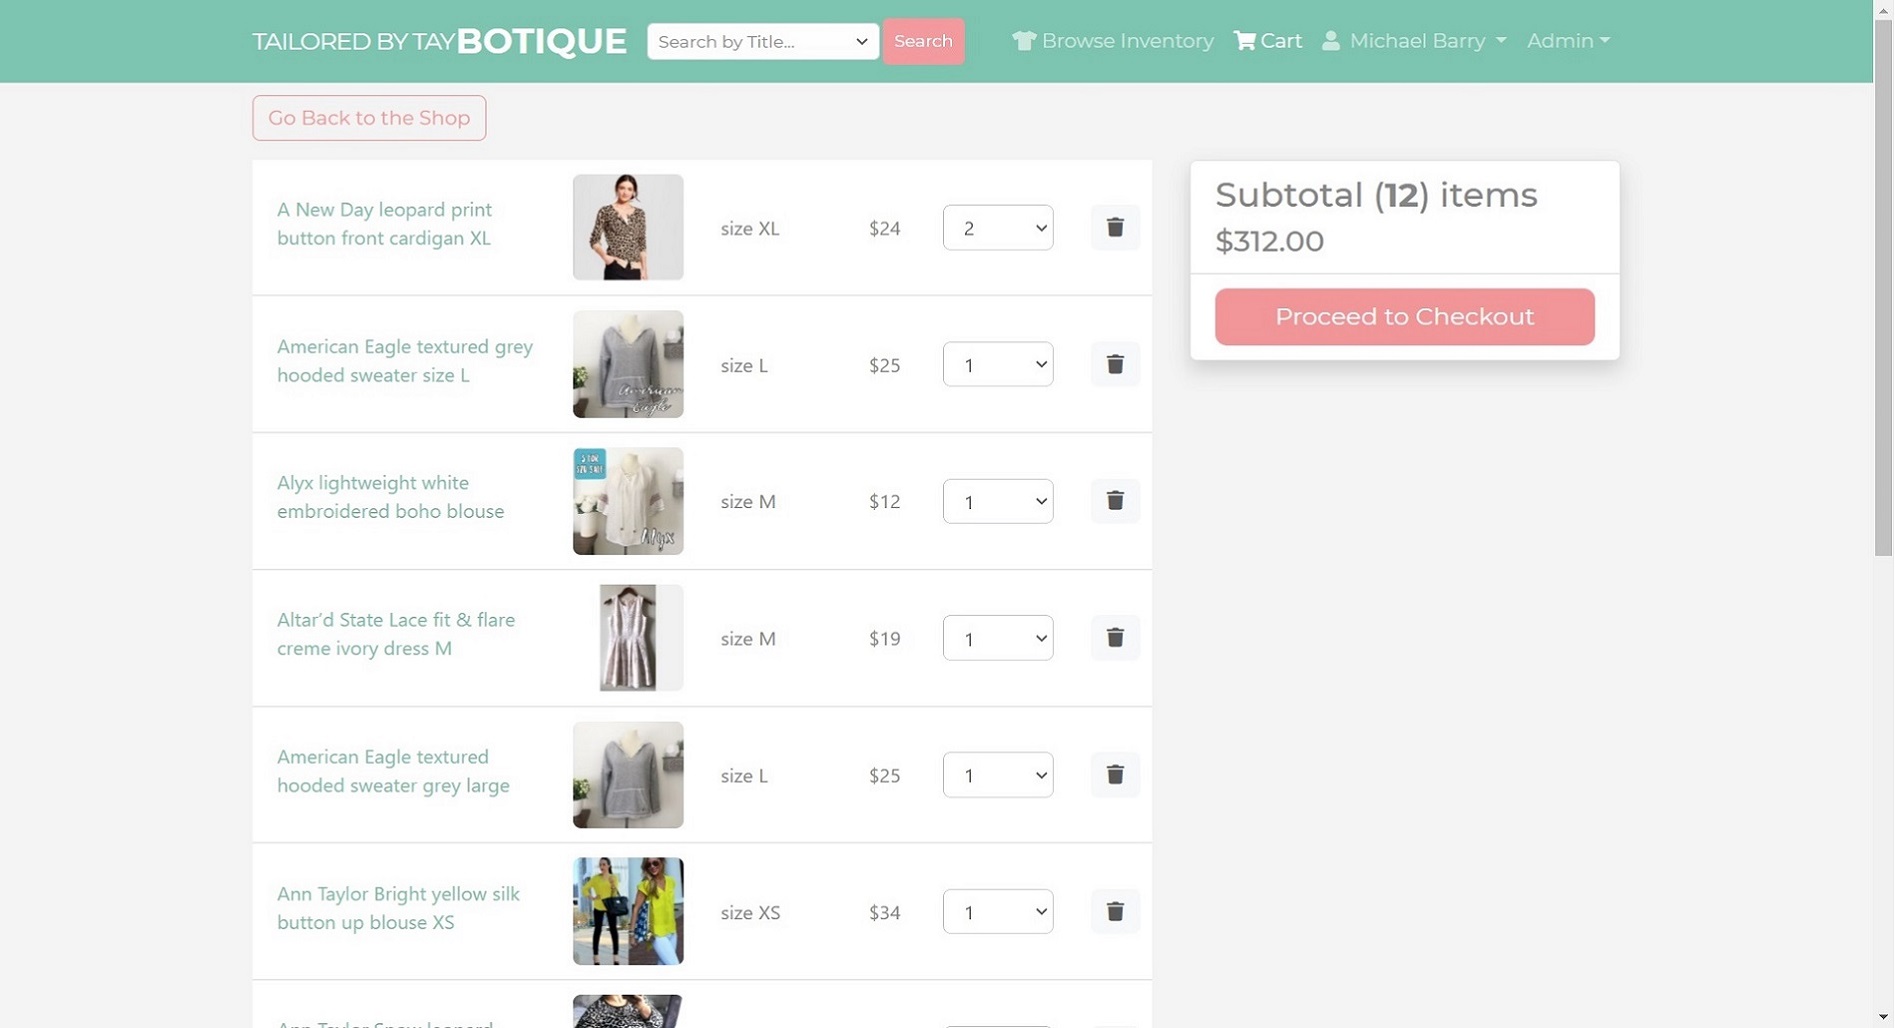
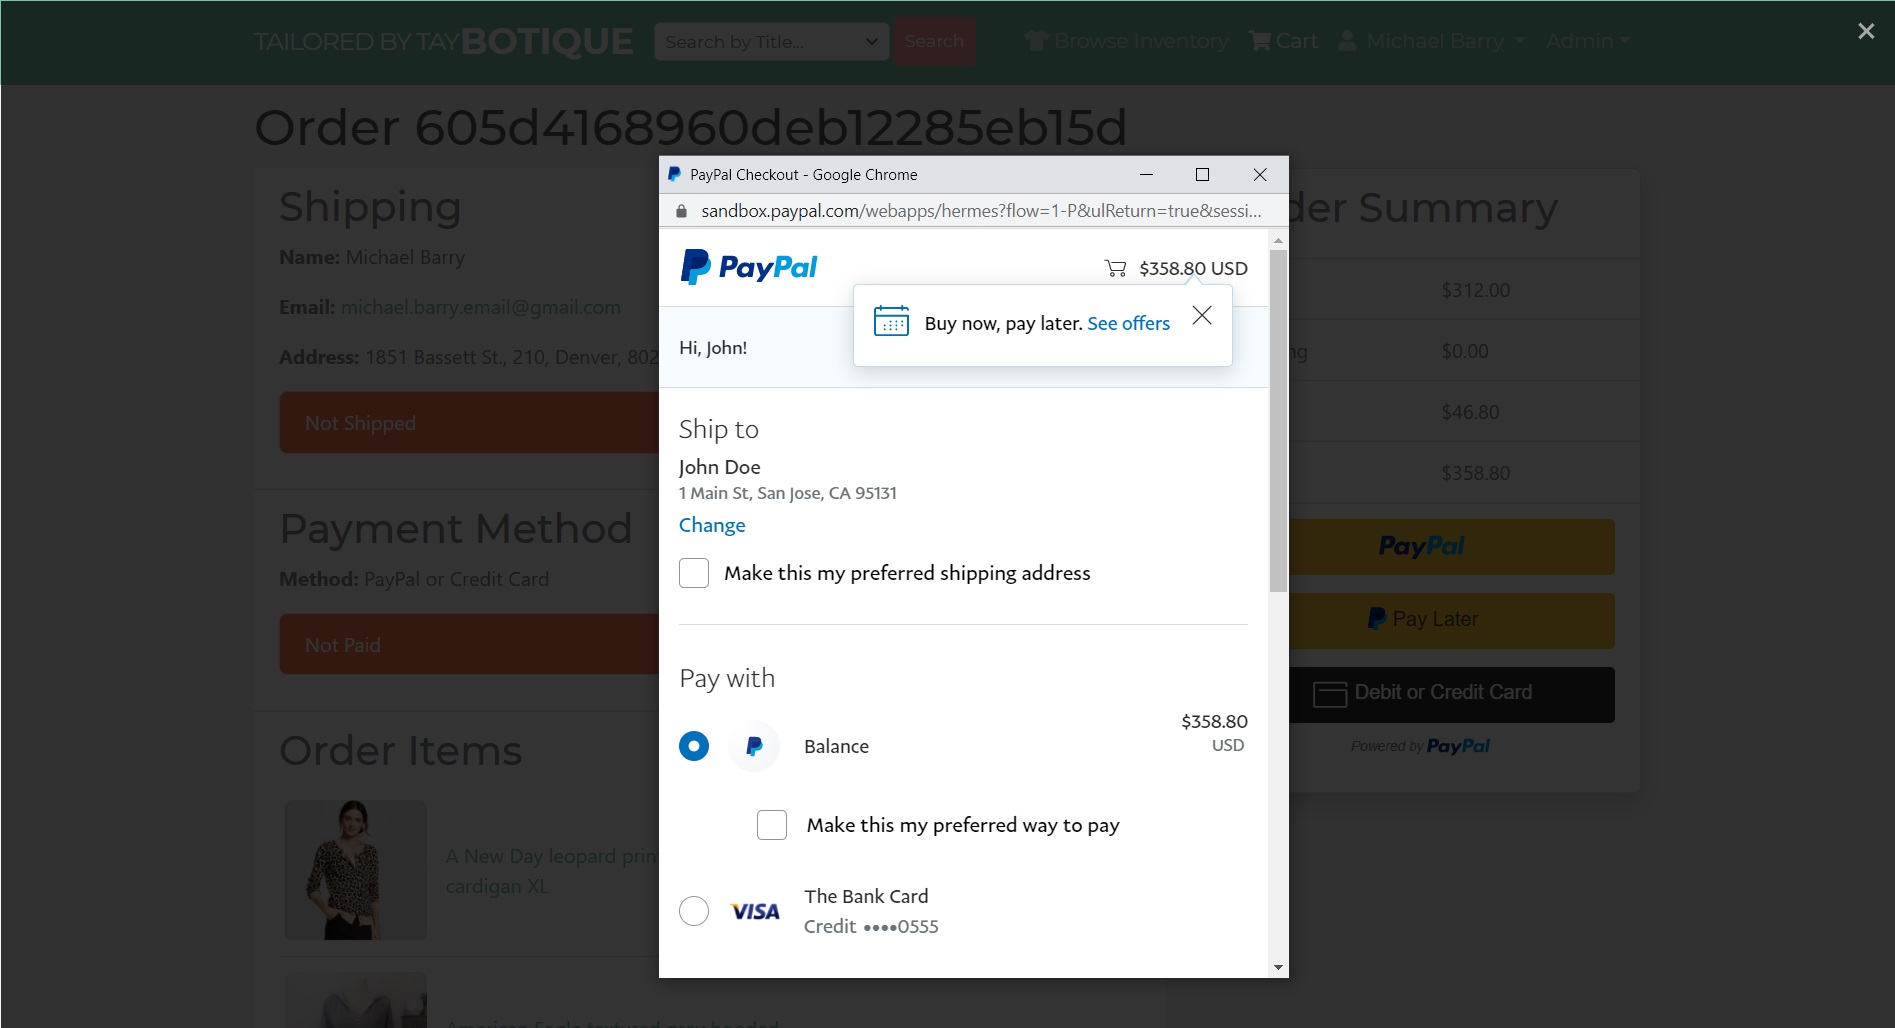
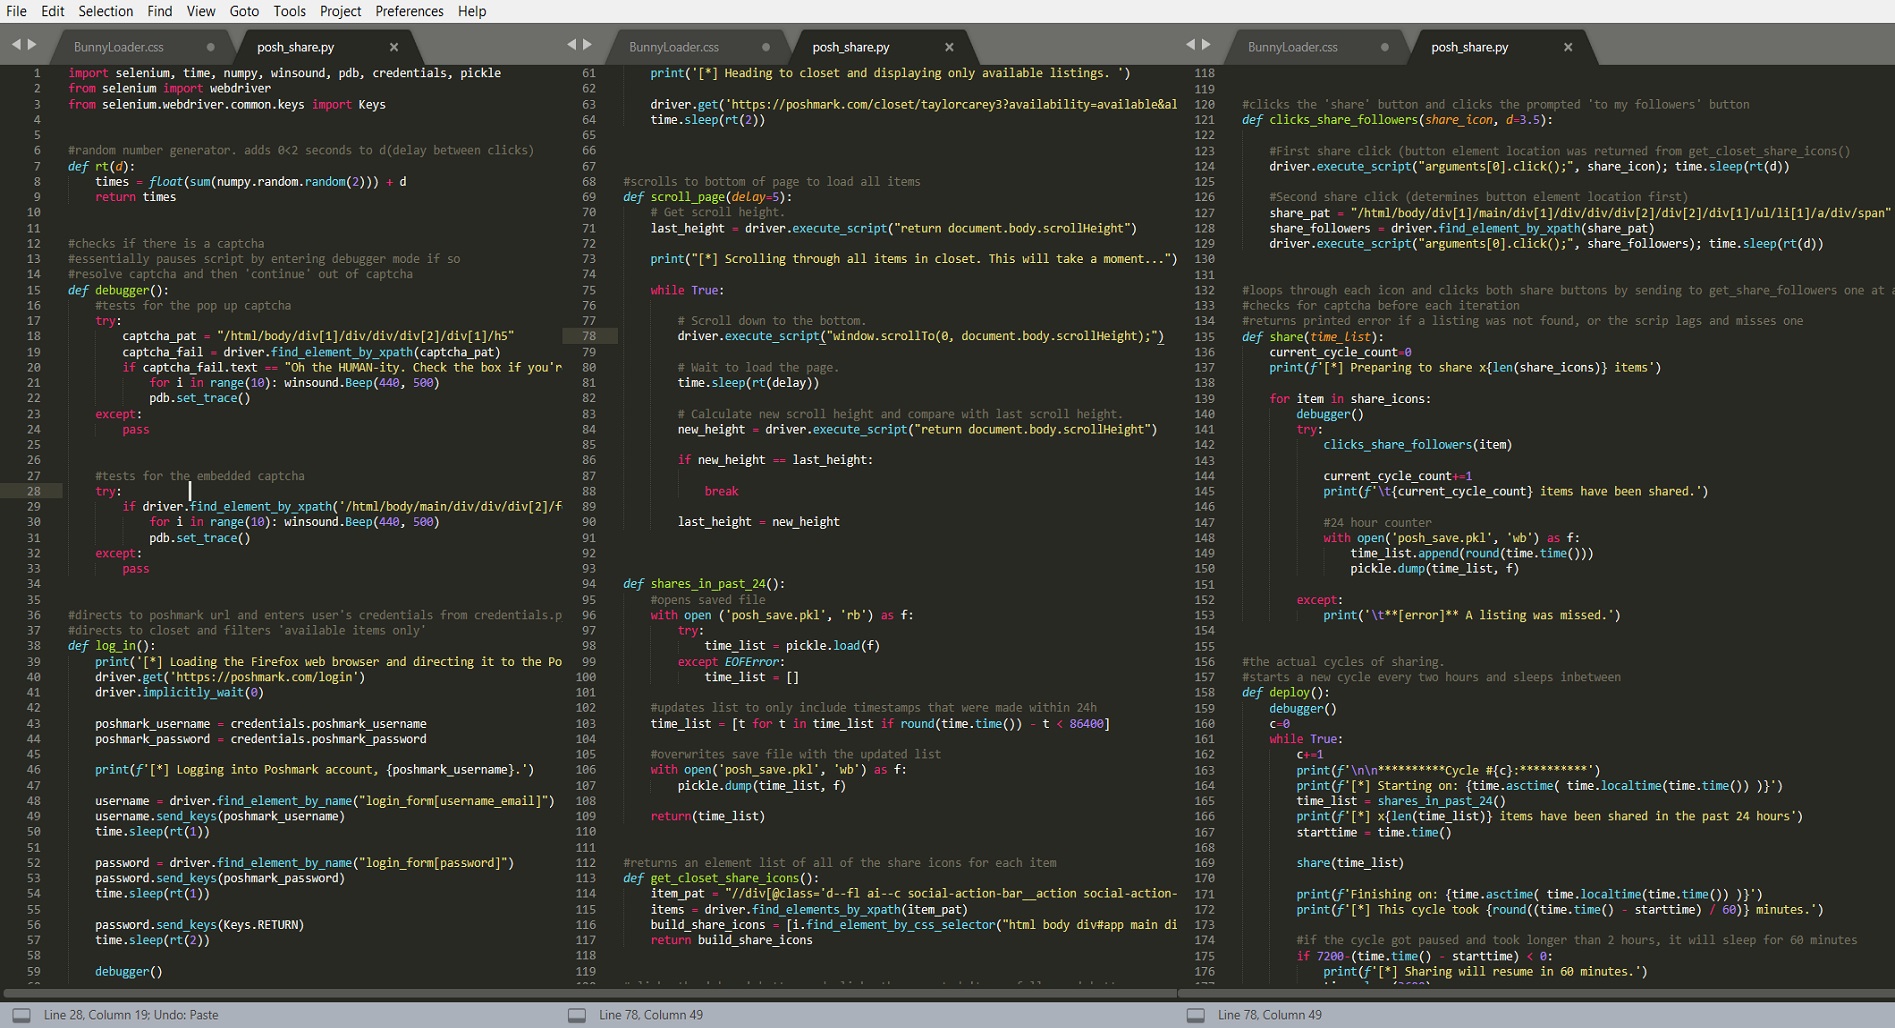
I'm a self-taught full stack web developer with a passion for React and its ecosystem. My technical toolkit includes Node.js, Express, PostgreSQL, Auth0, Mapbox, and a variety of React libraries like Material UI, Styled Components, React Query, and Chart.js. My expertise extends to Next.js, Supabase, Vercel, PHP, WordPress, Drupal, MongoDB, Firebase, Python, and more. I'm fascinated by AI's potential and actively explore its applications.
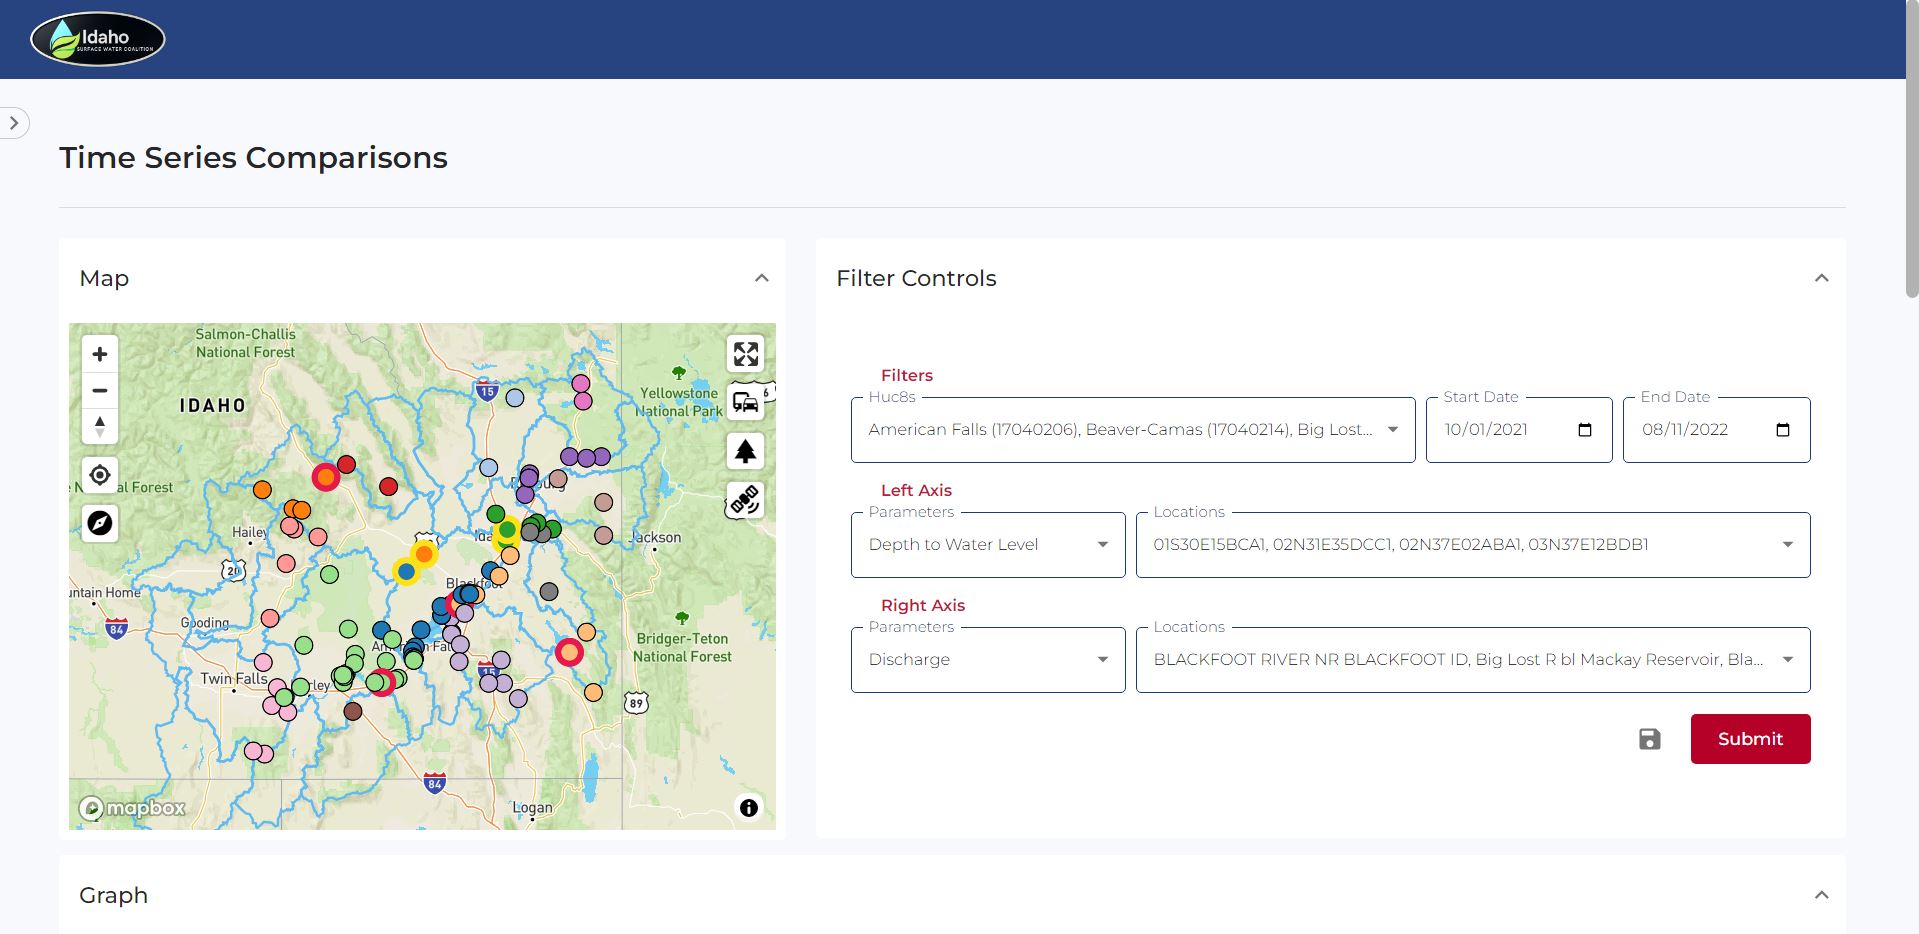
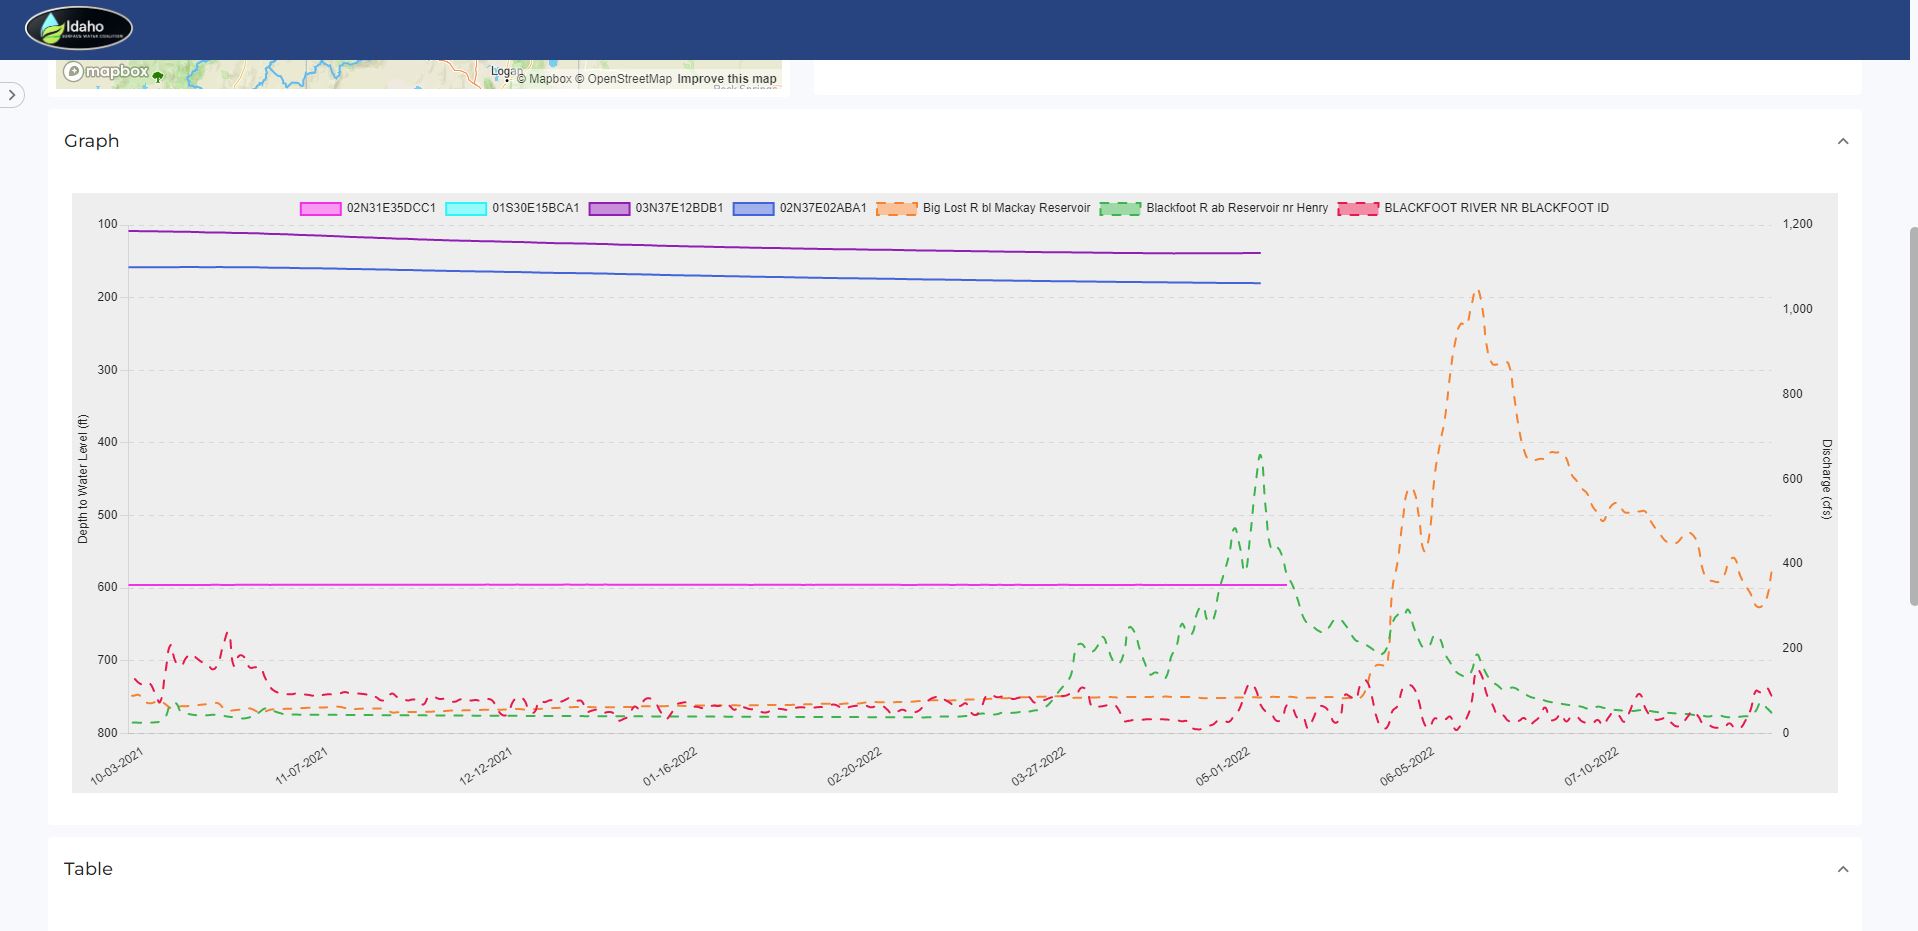
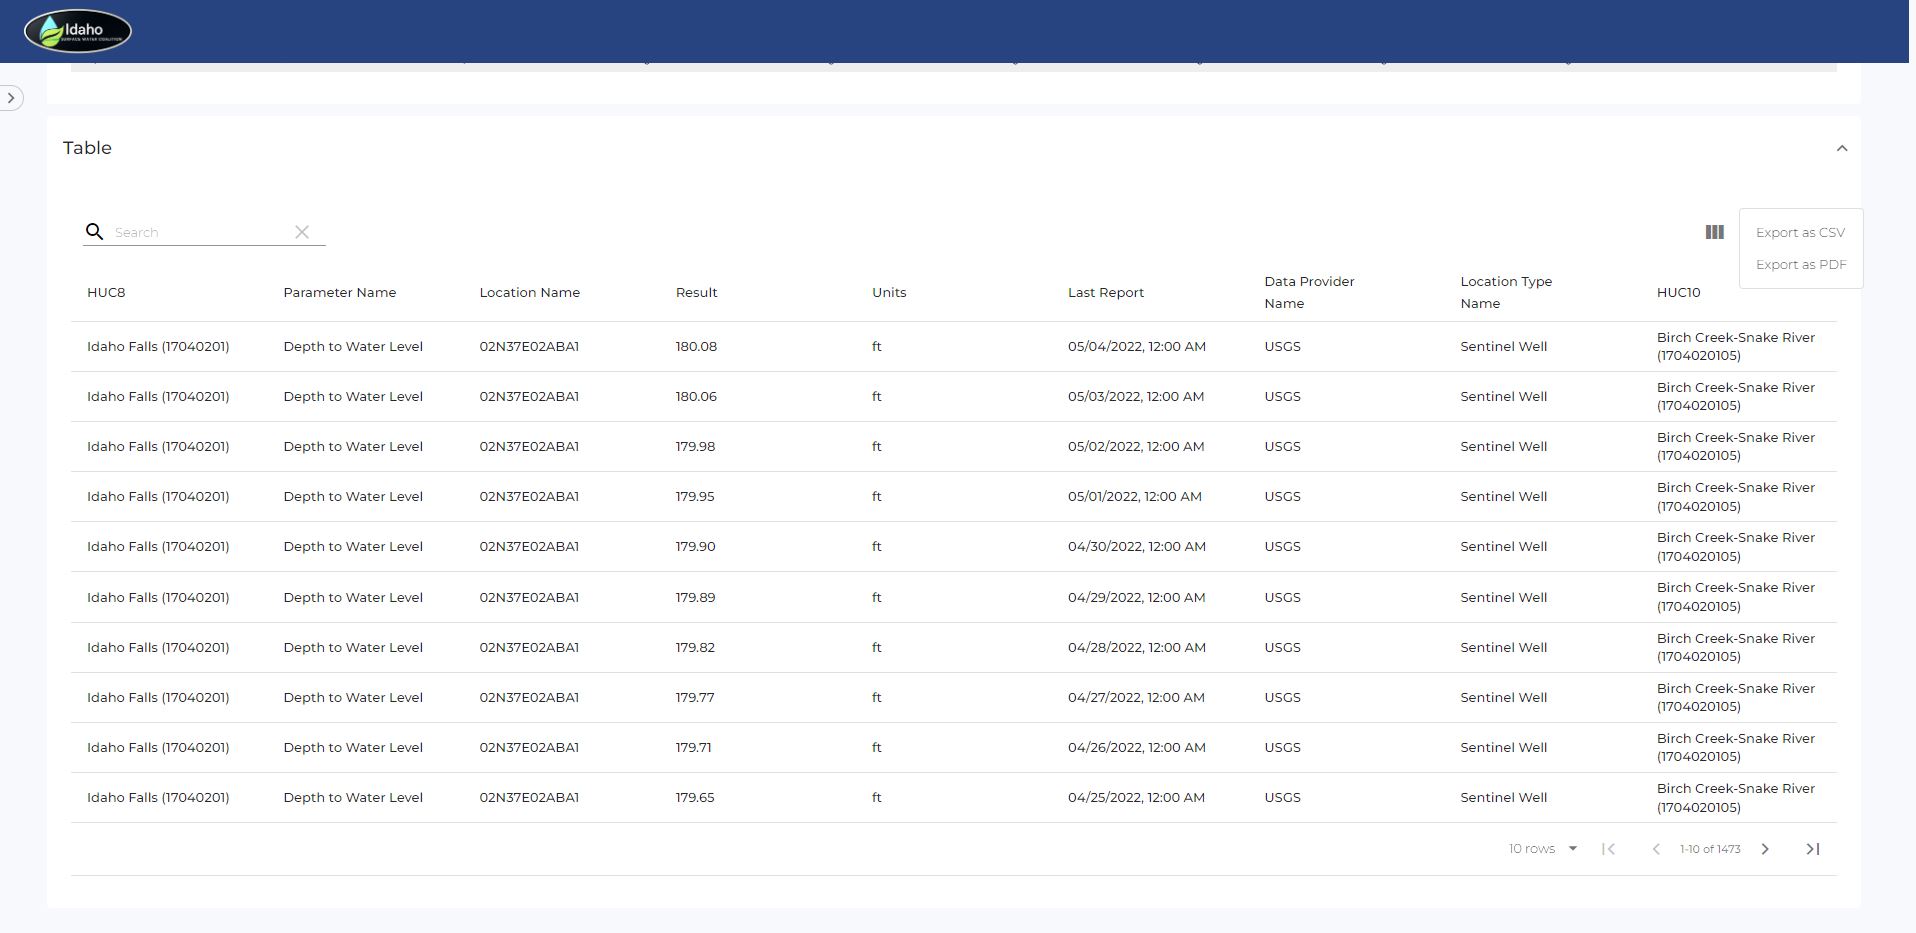
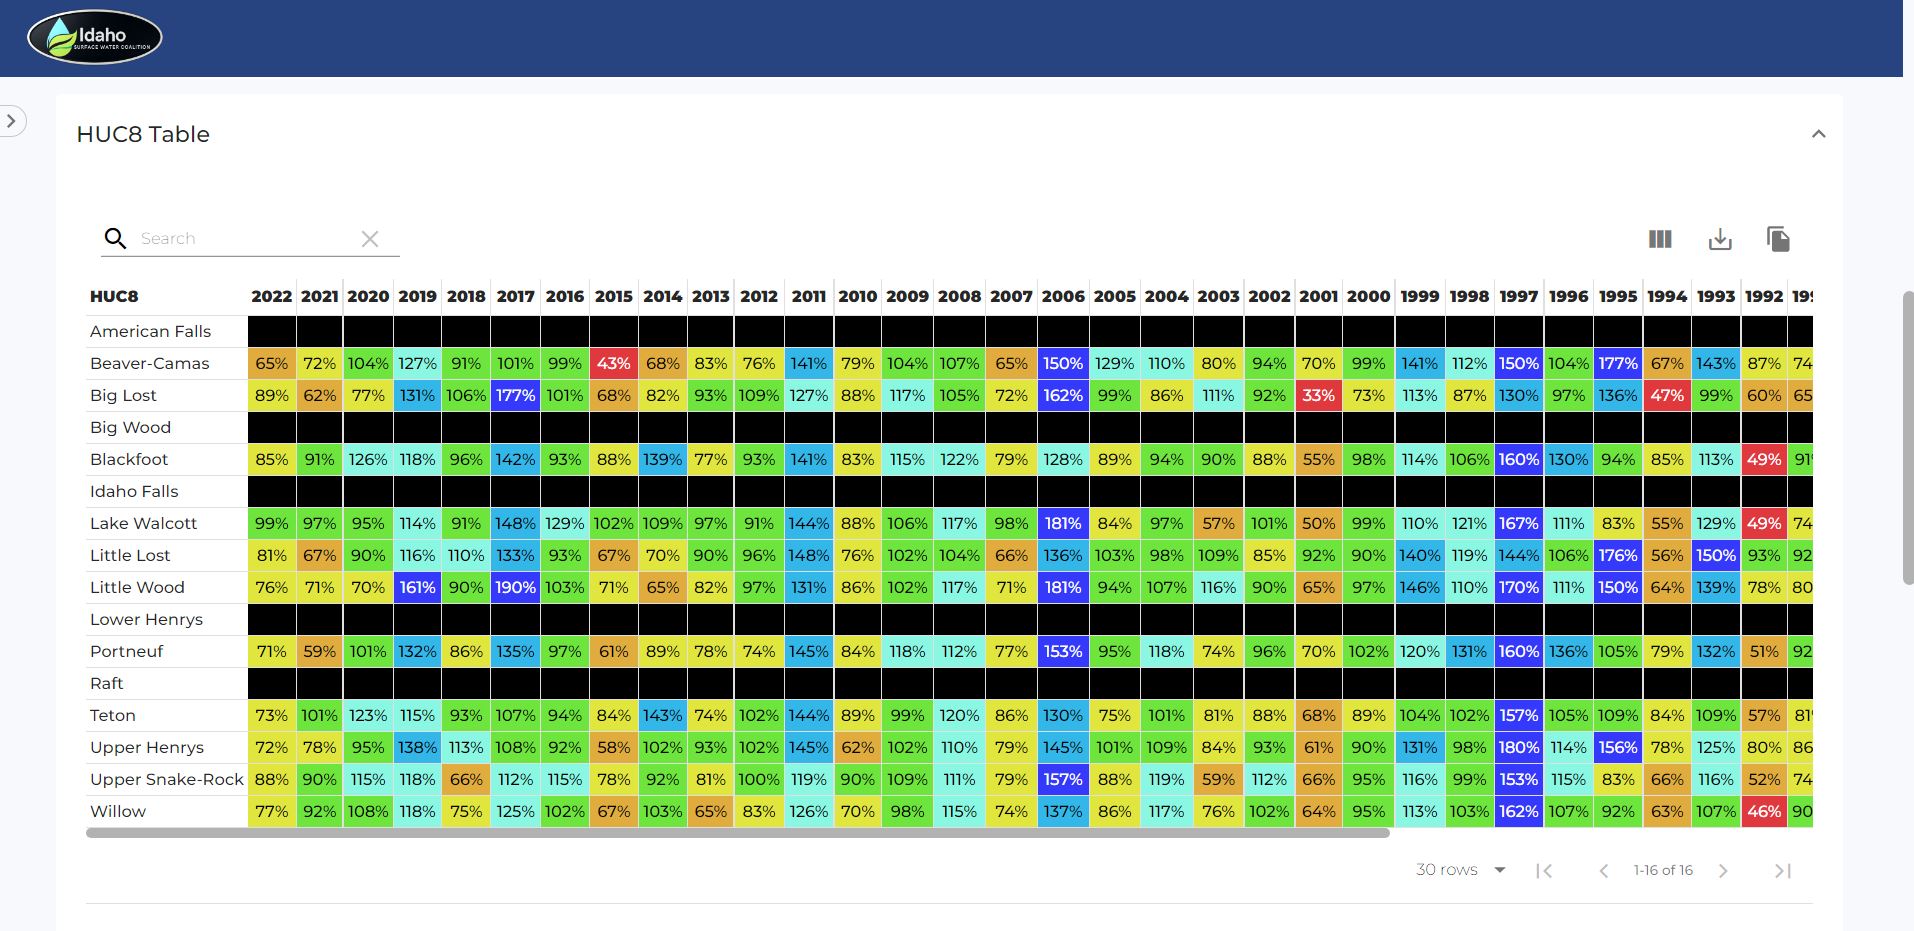
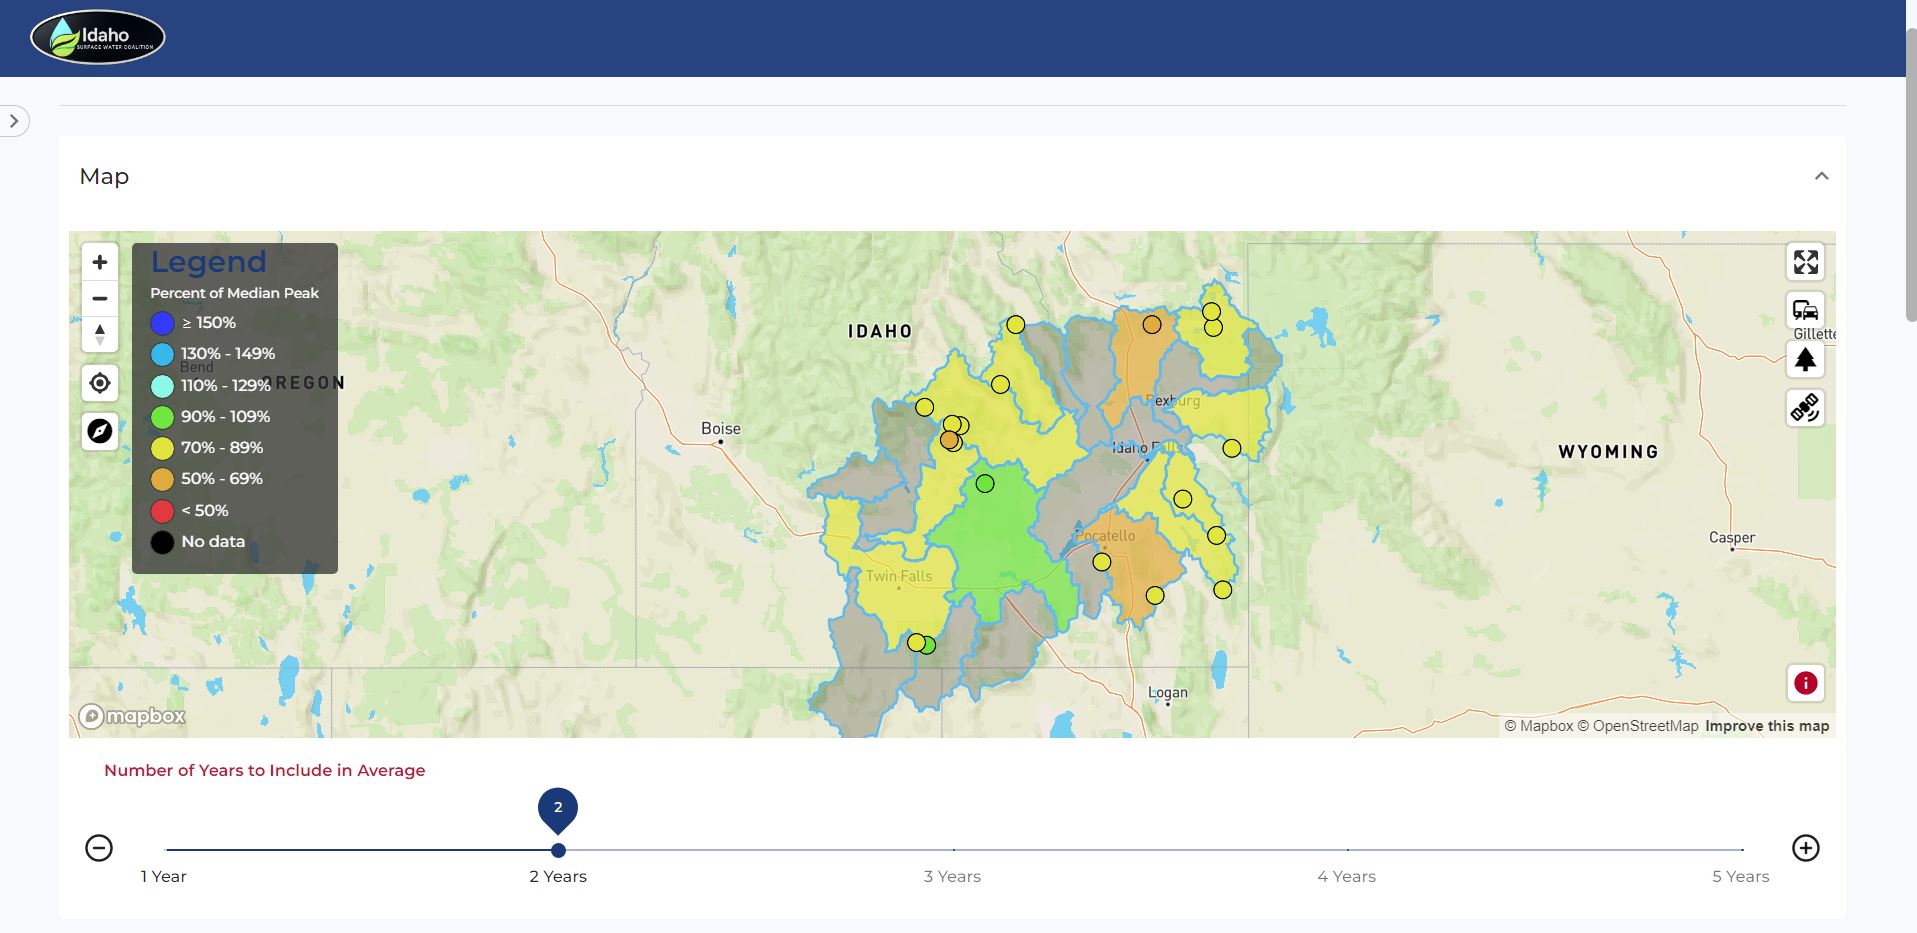
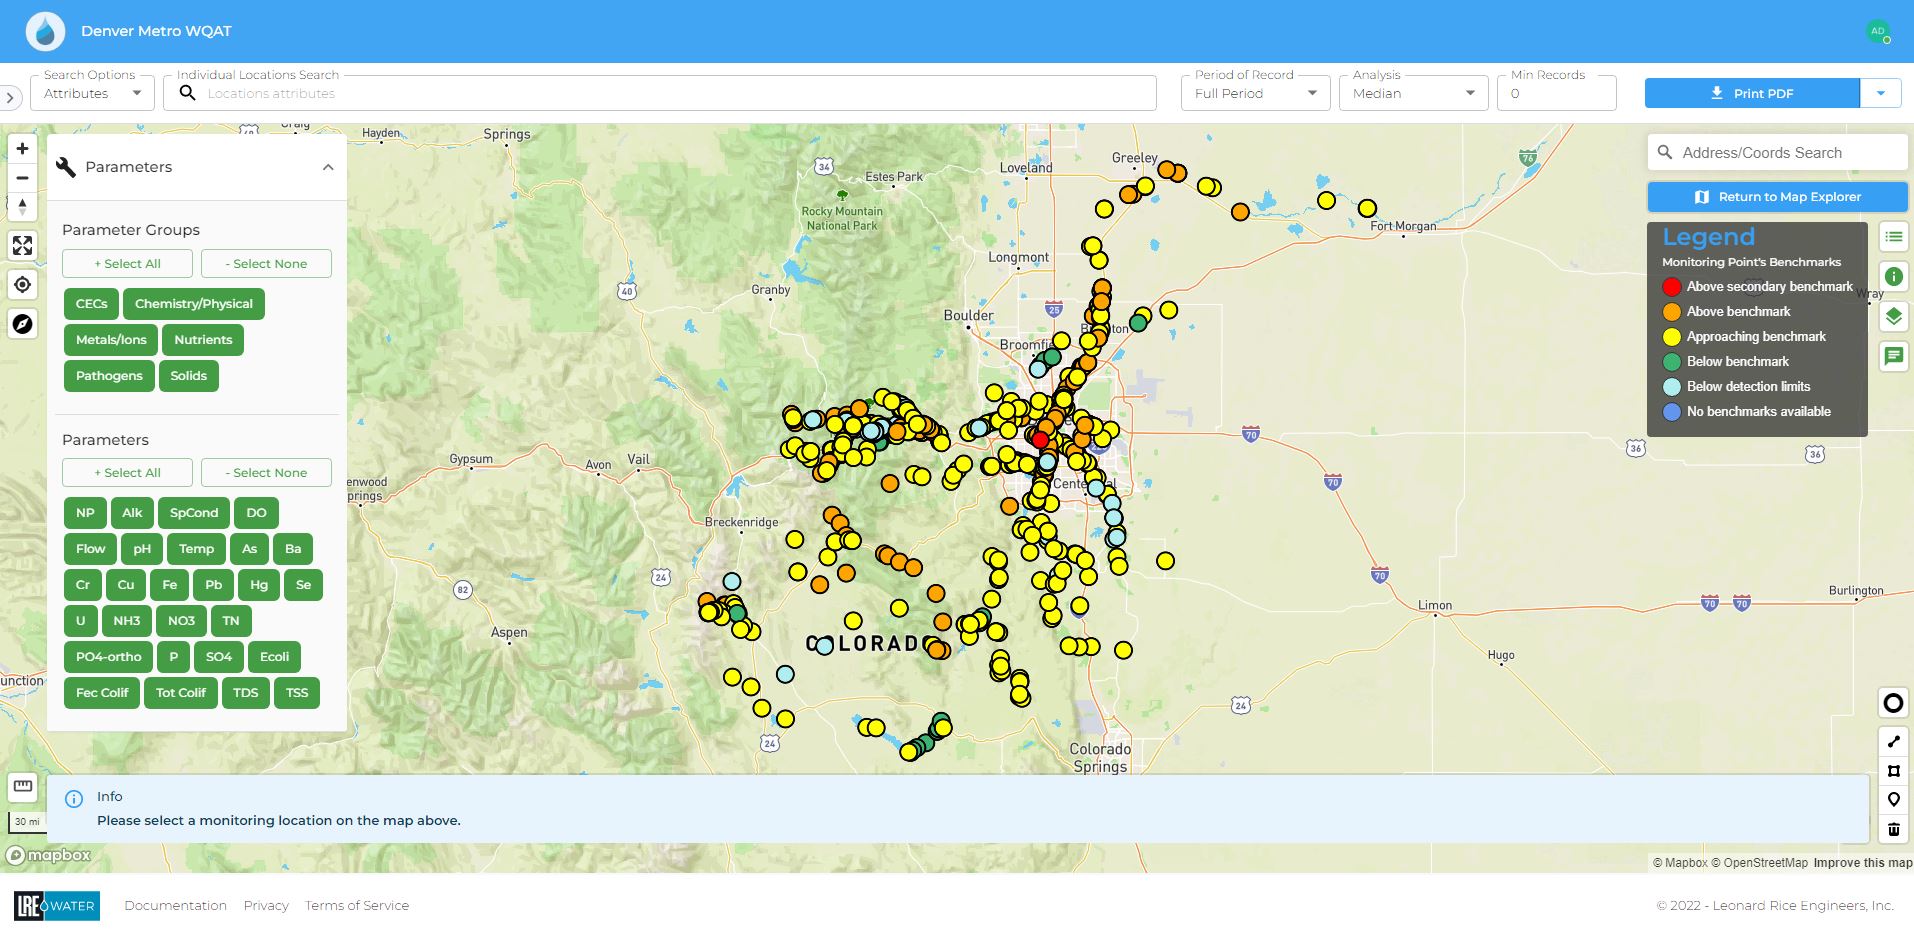
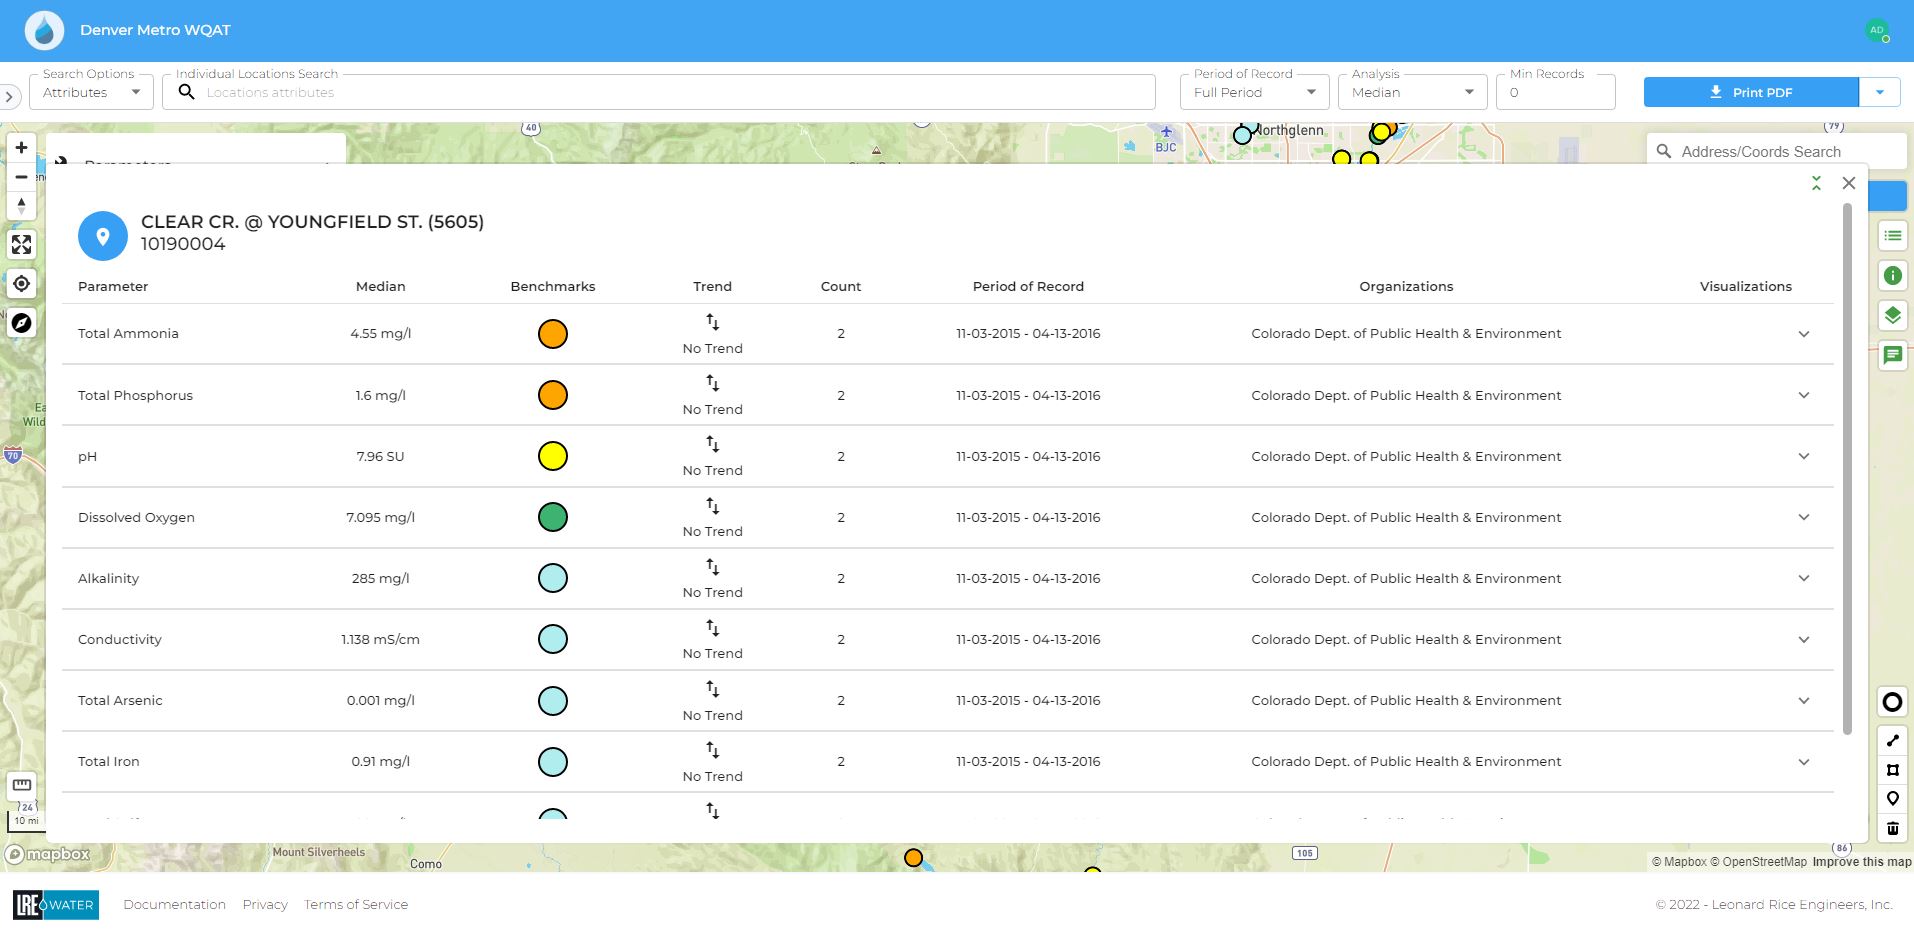
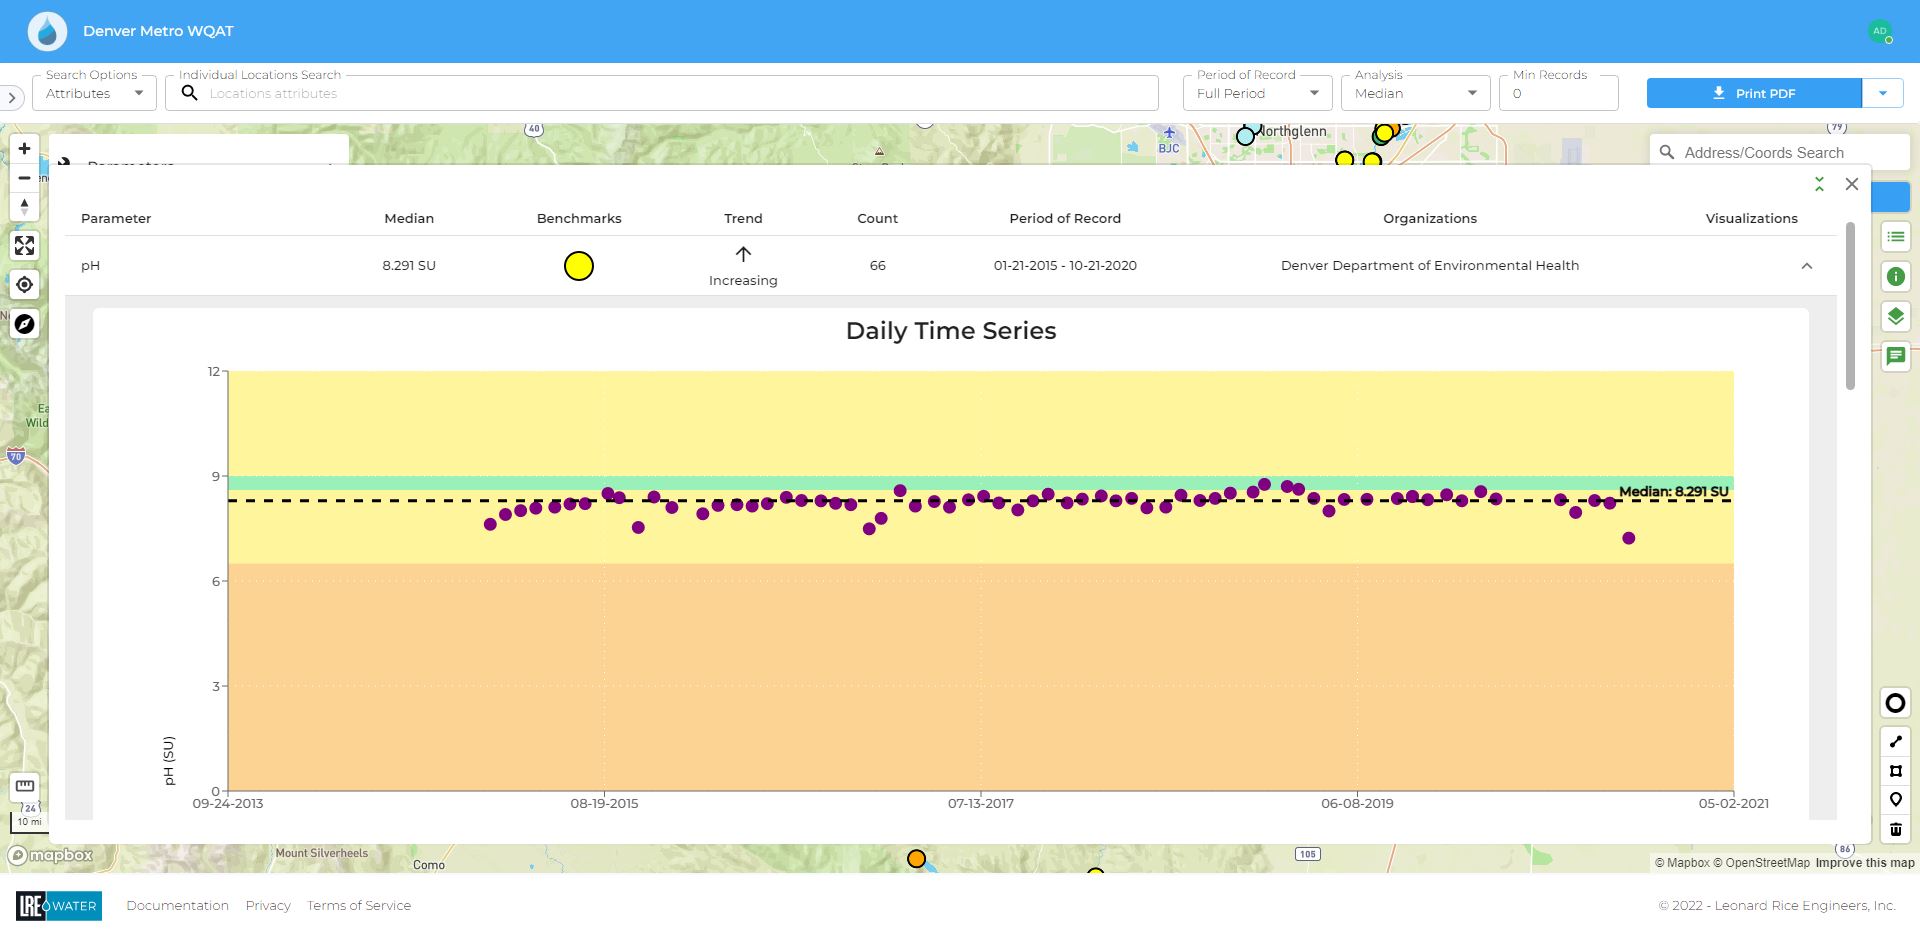
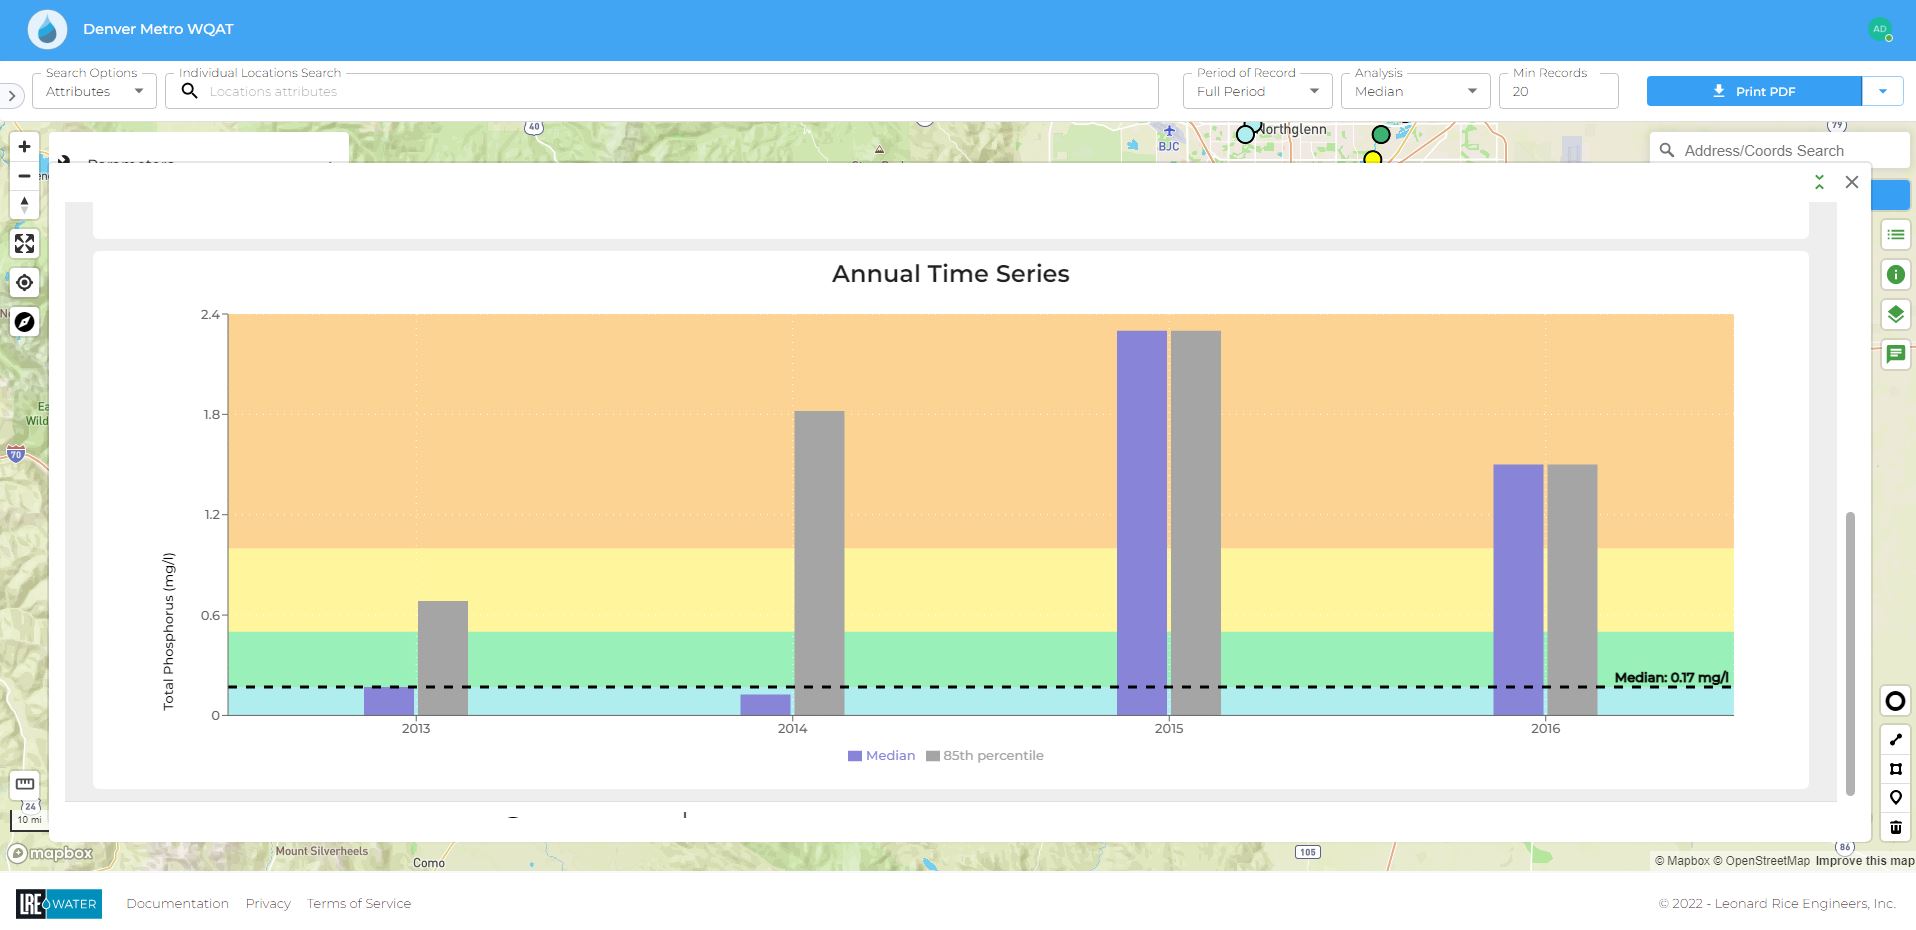
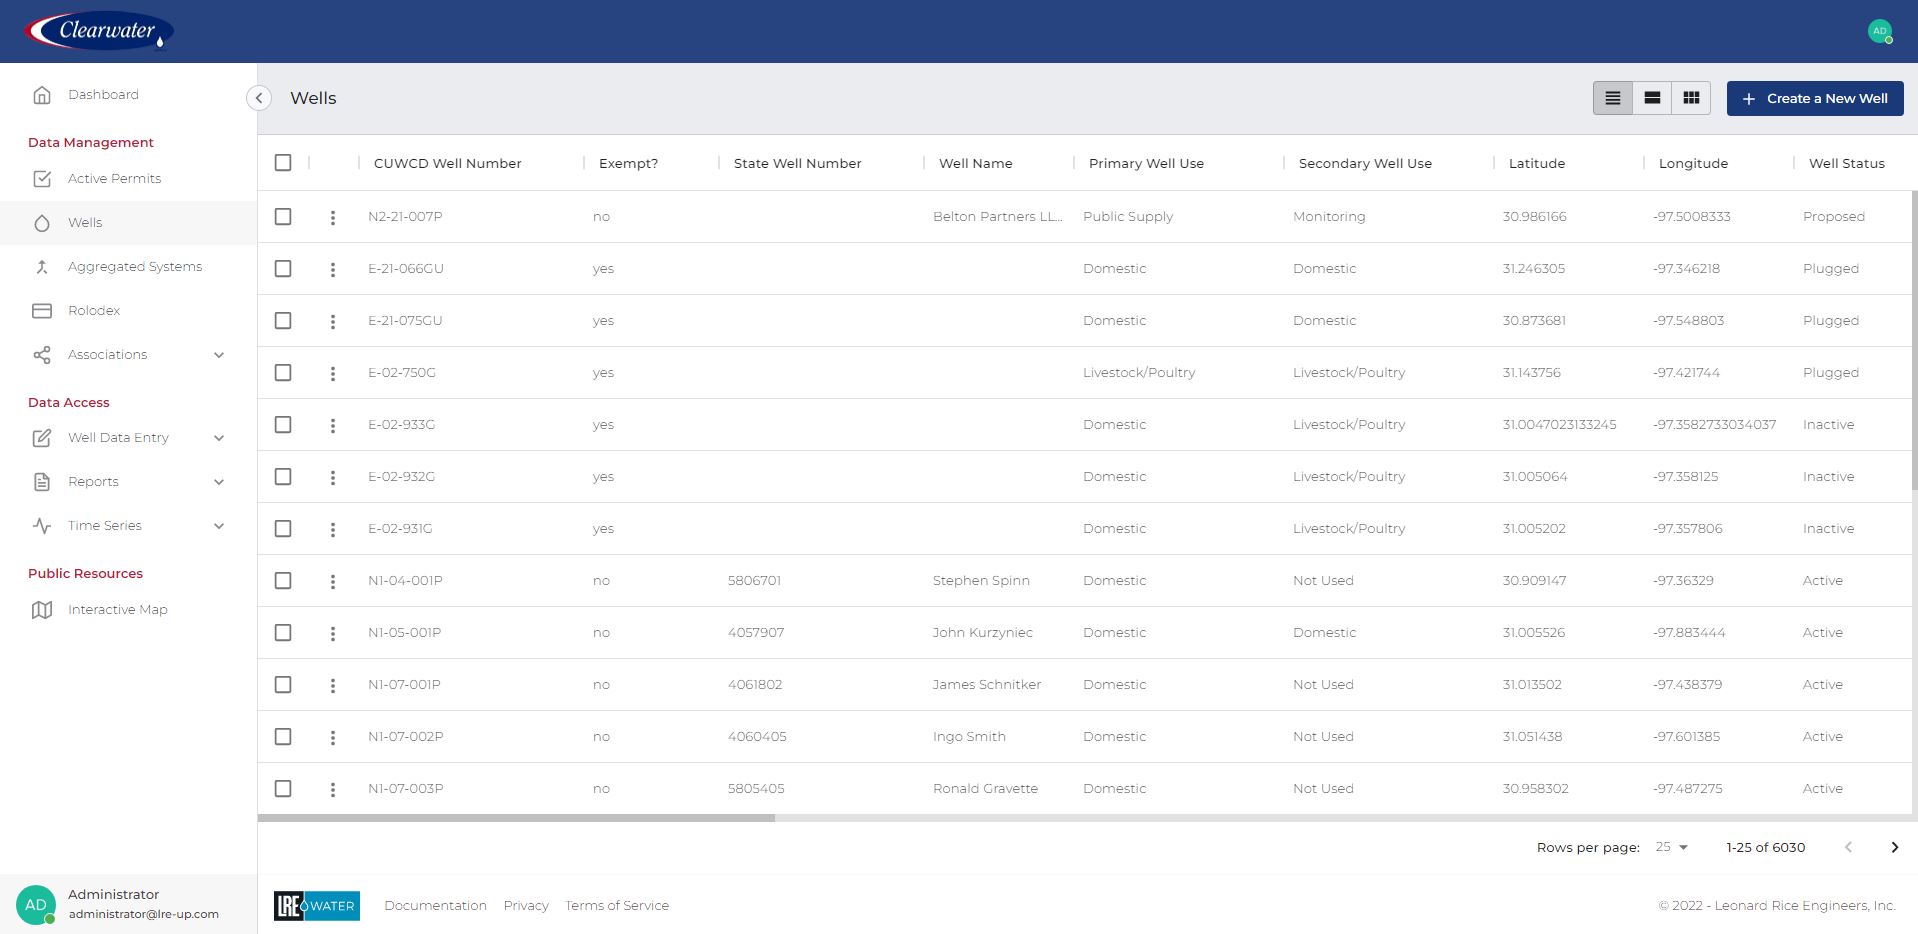
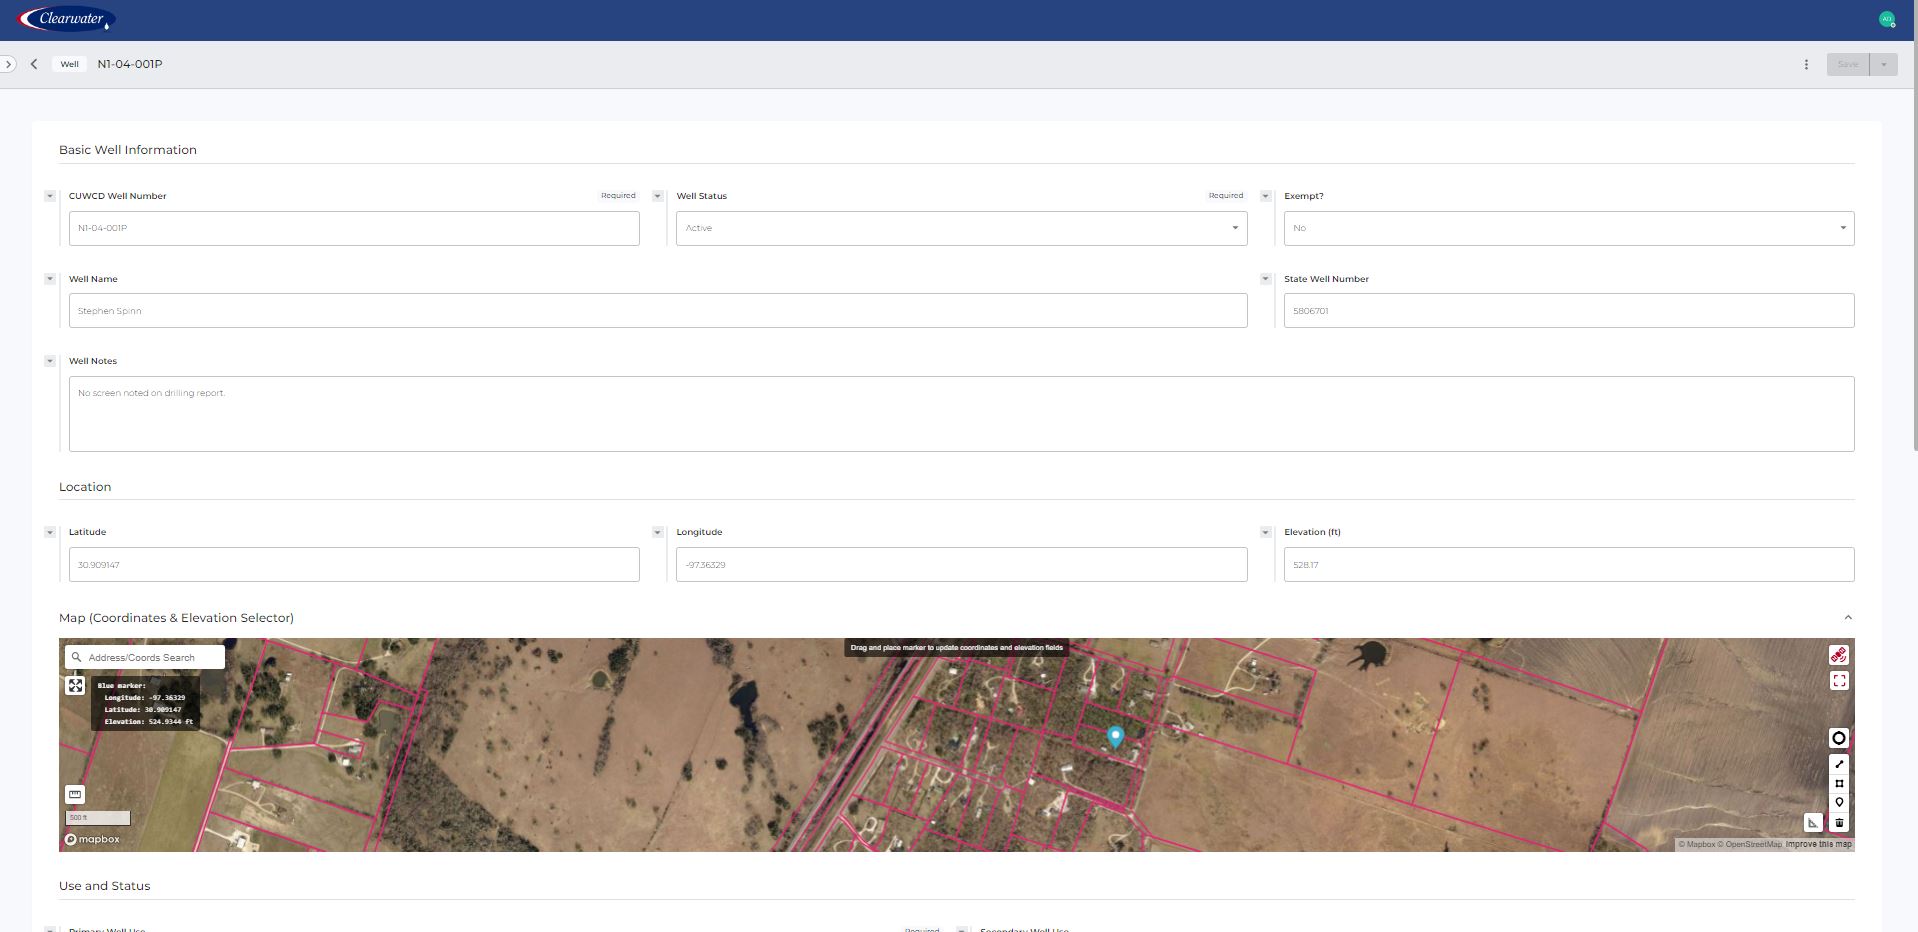
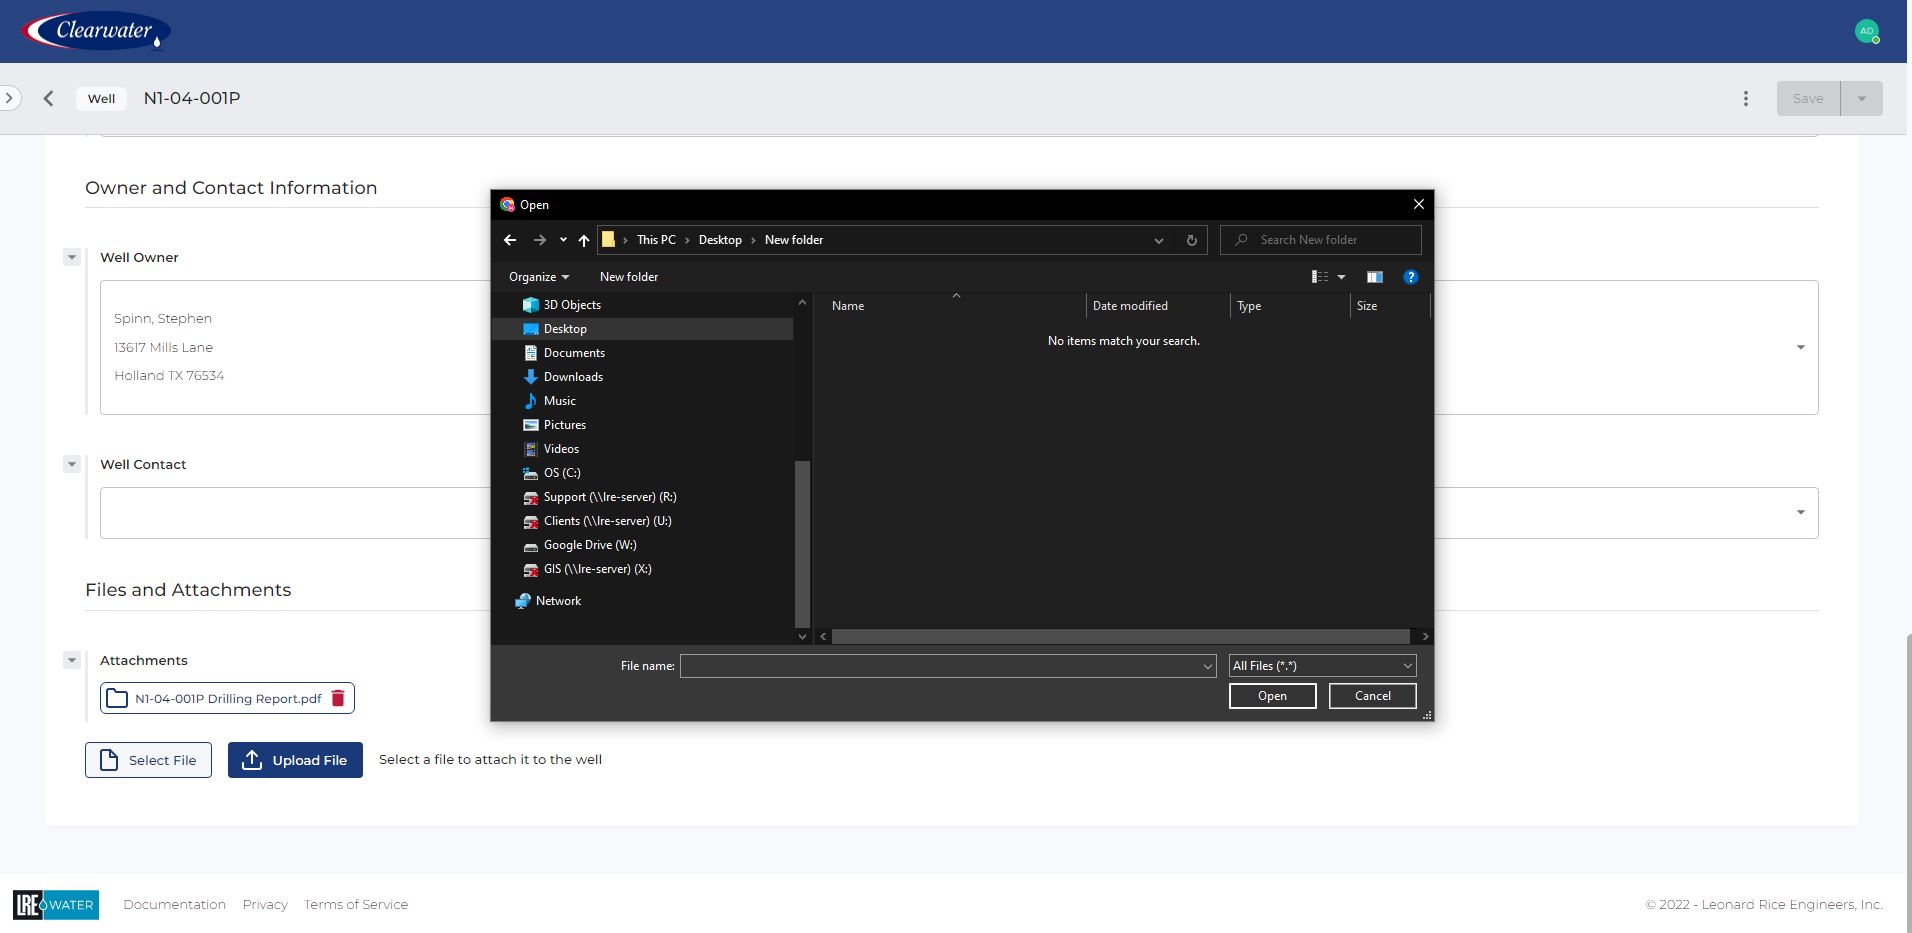
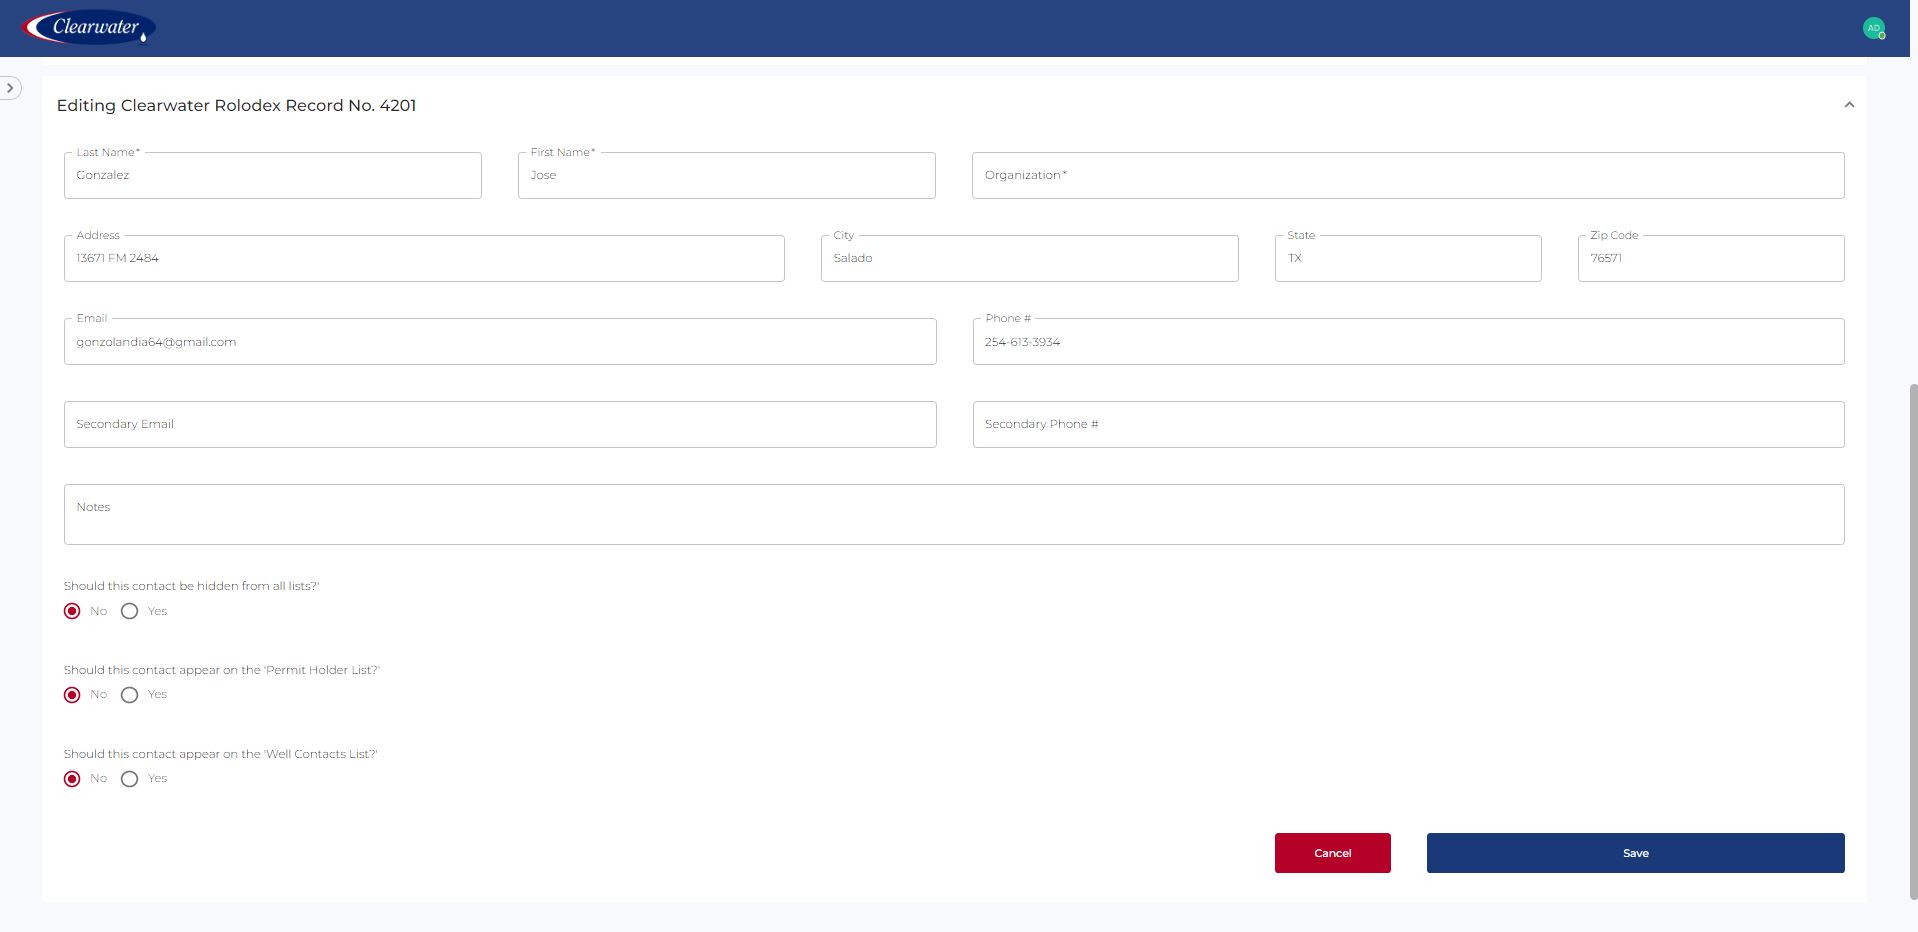
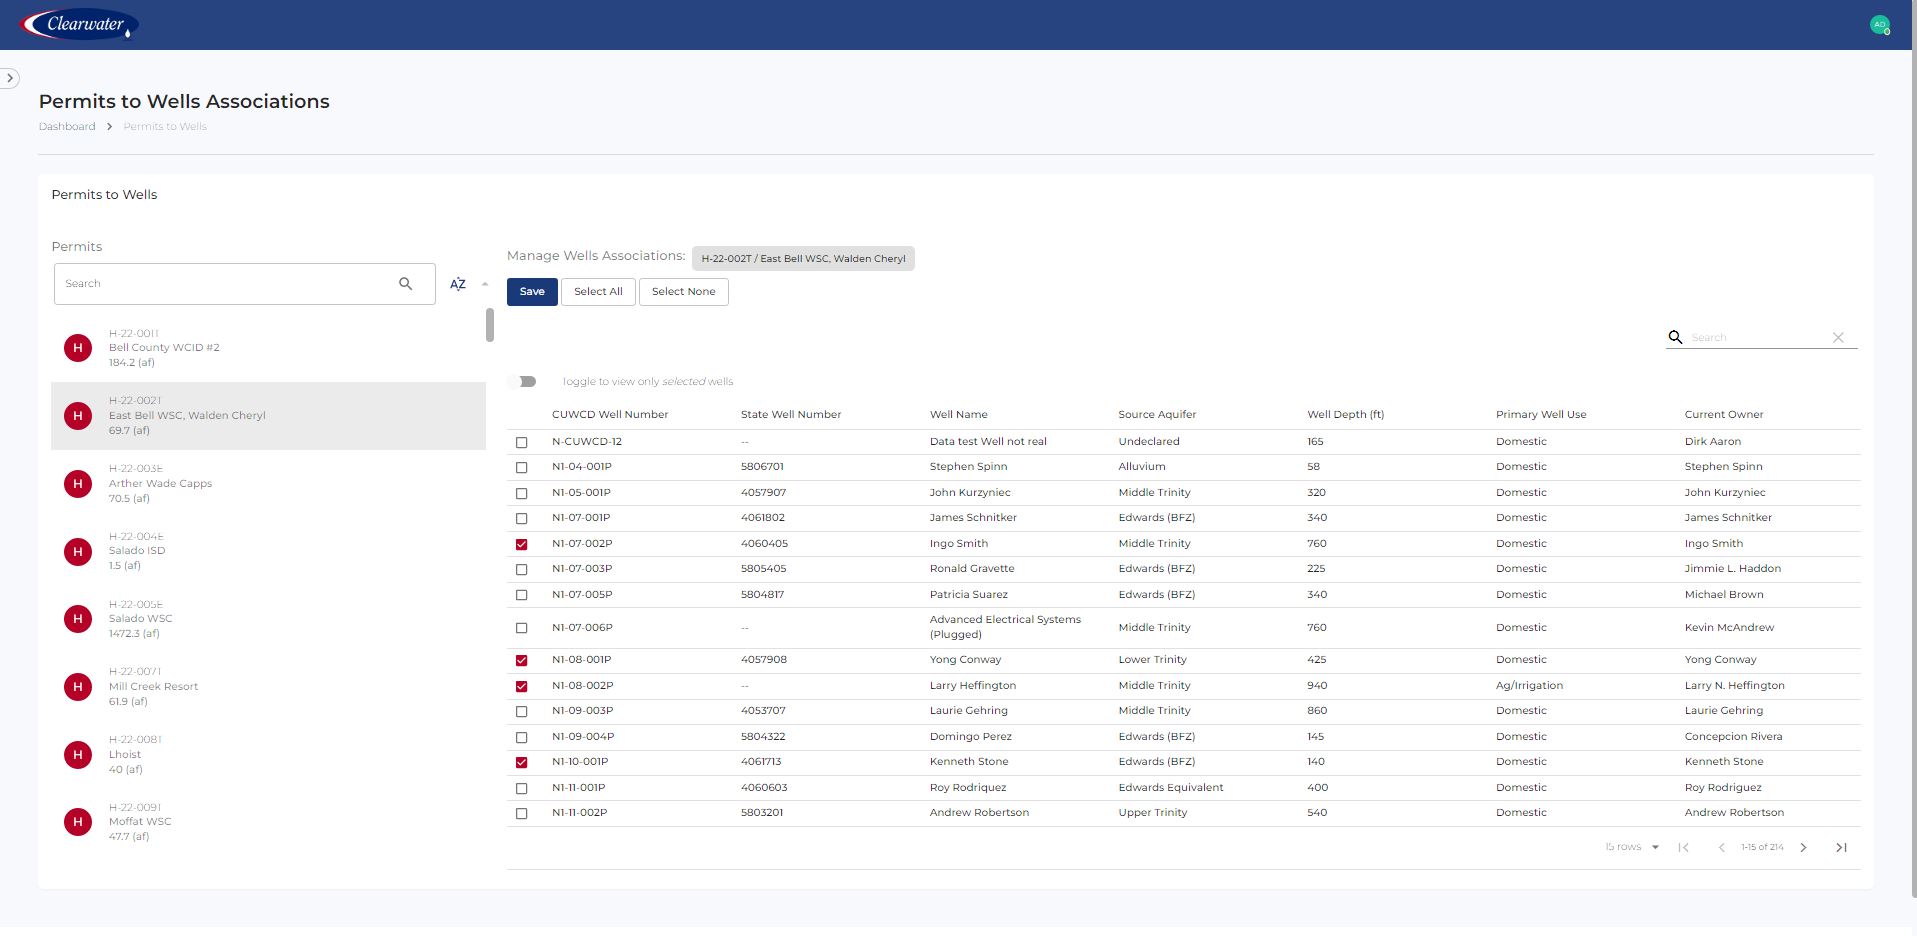
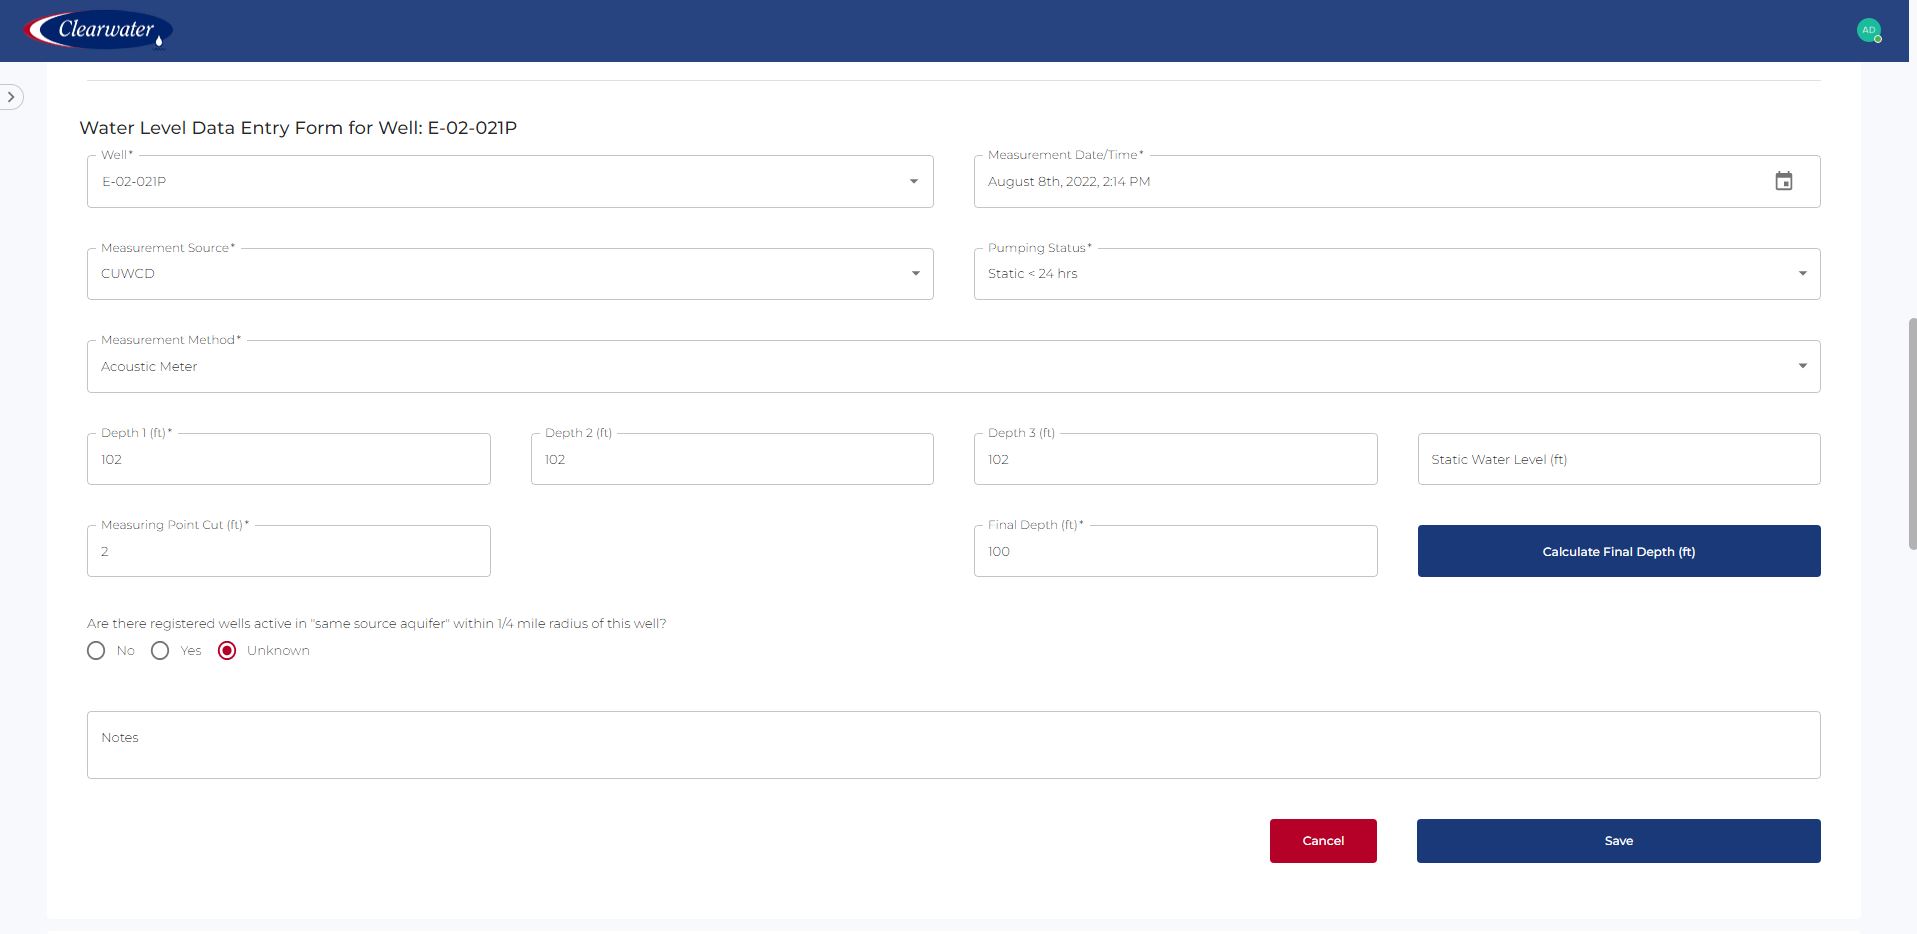
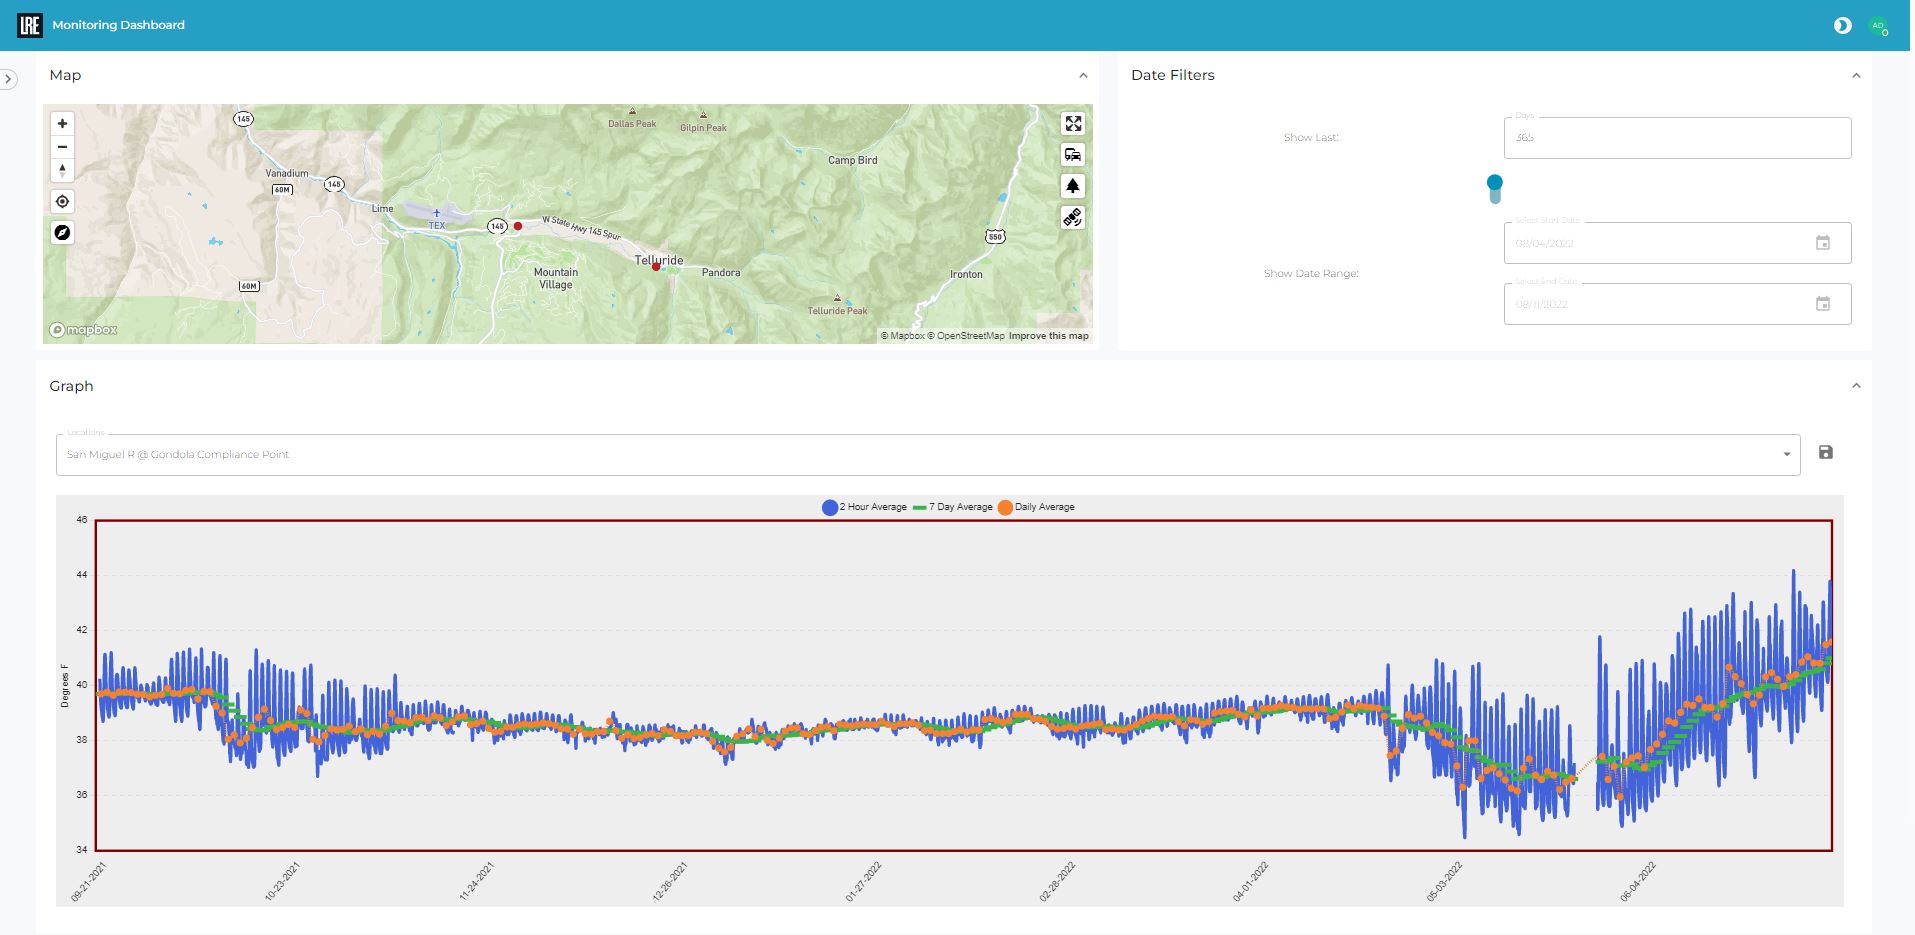
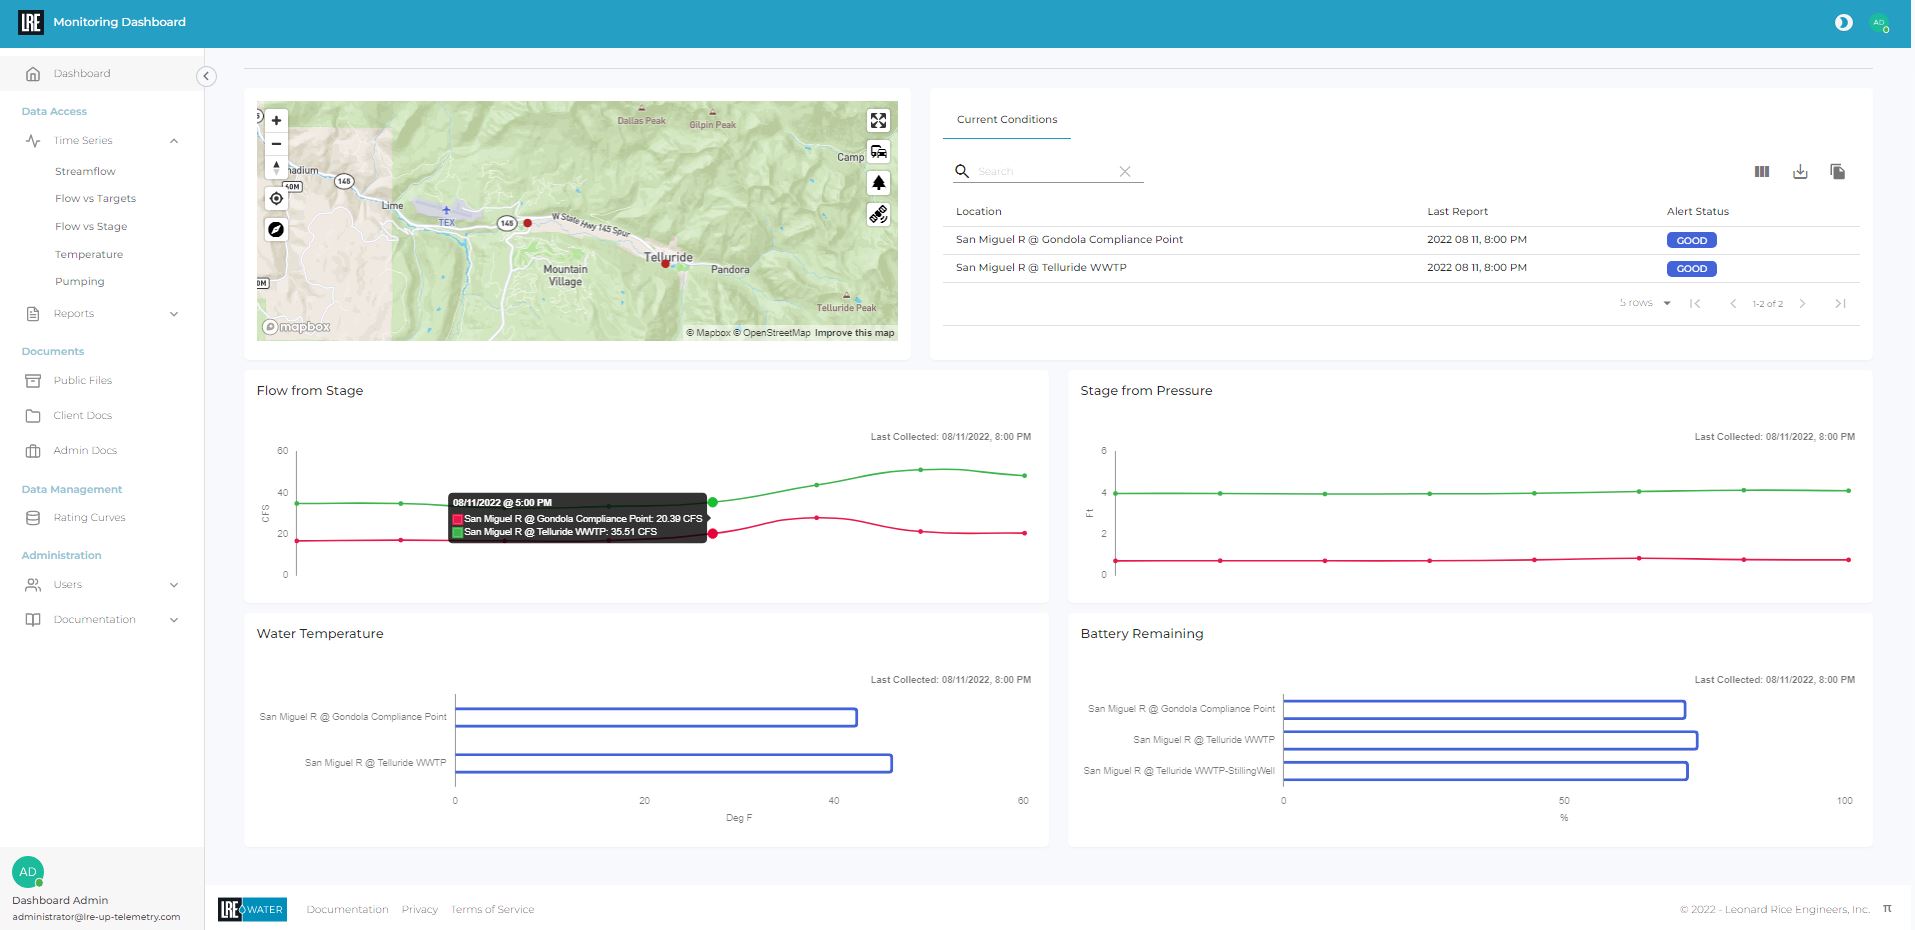
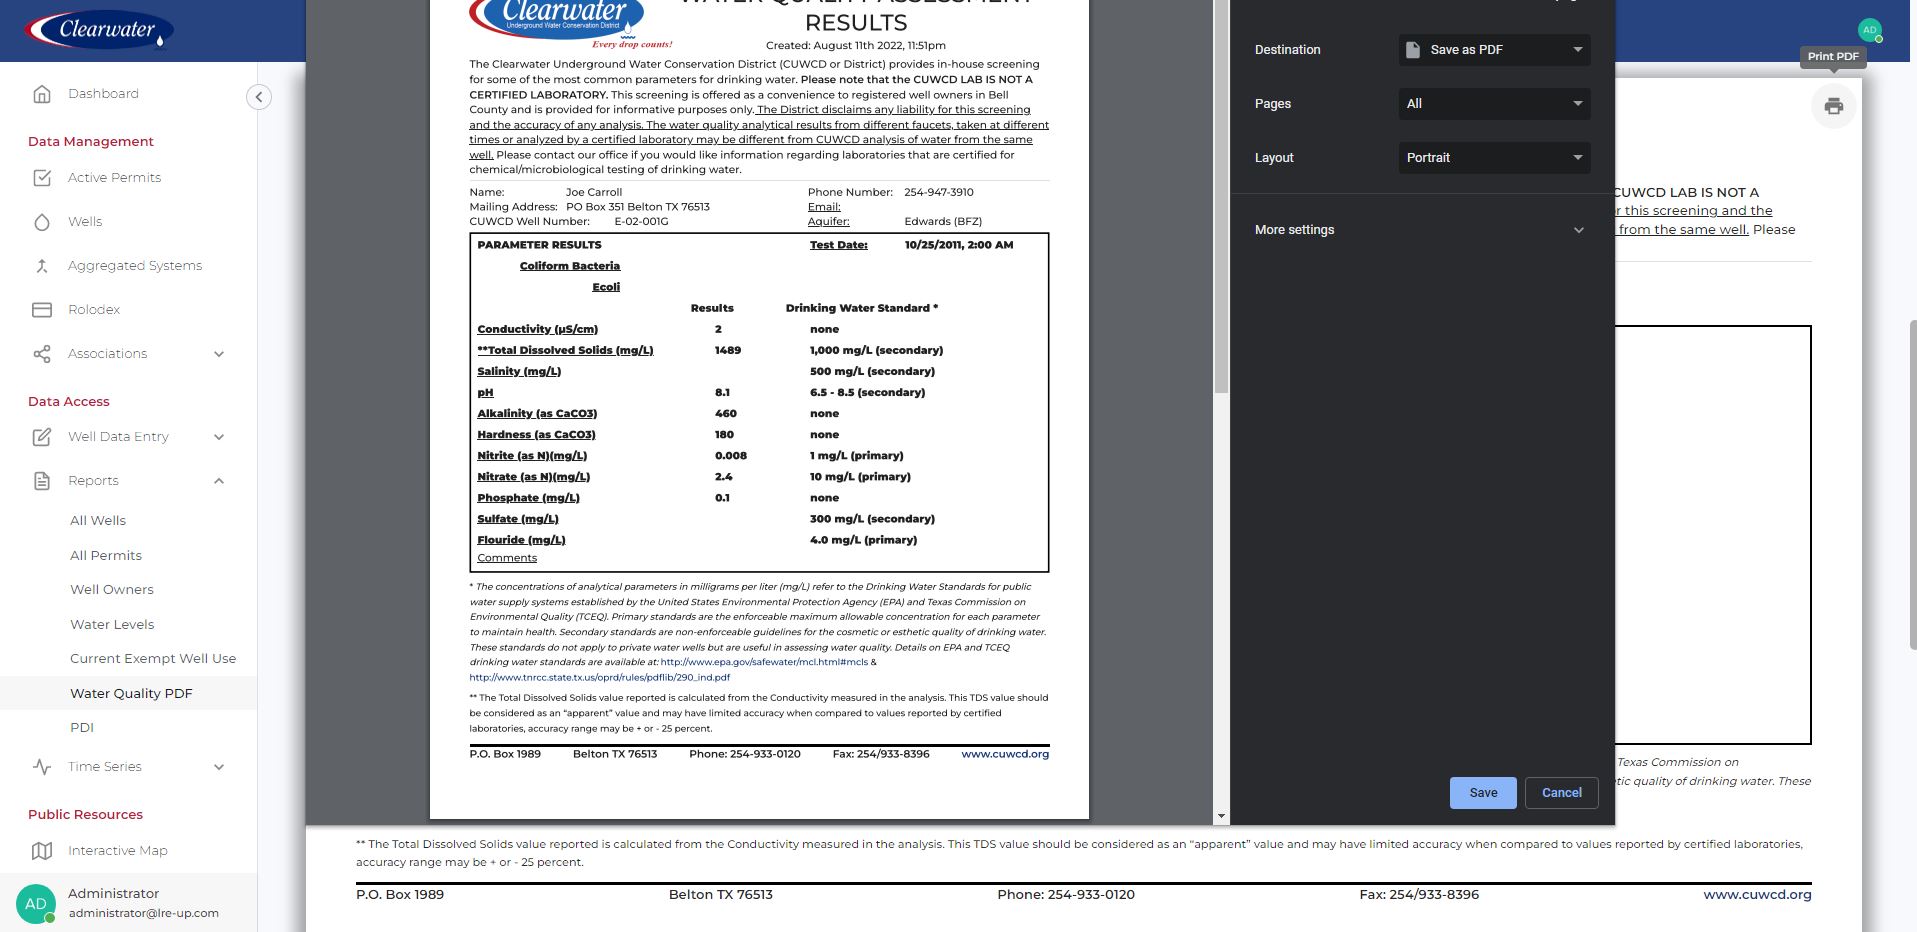
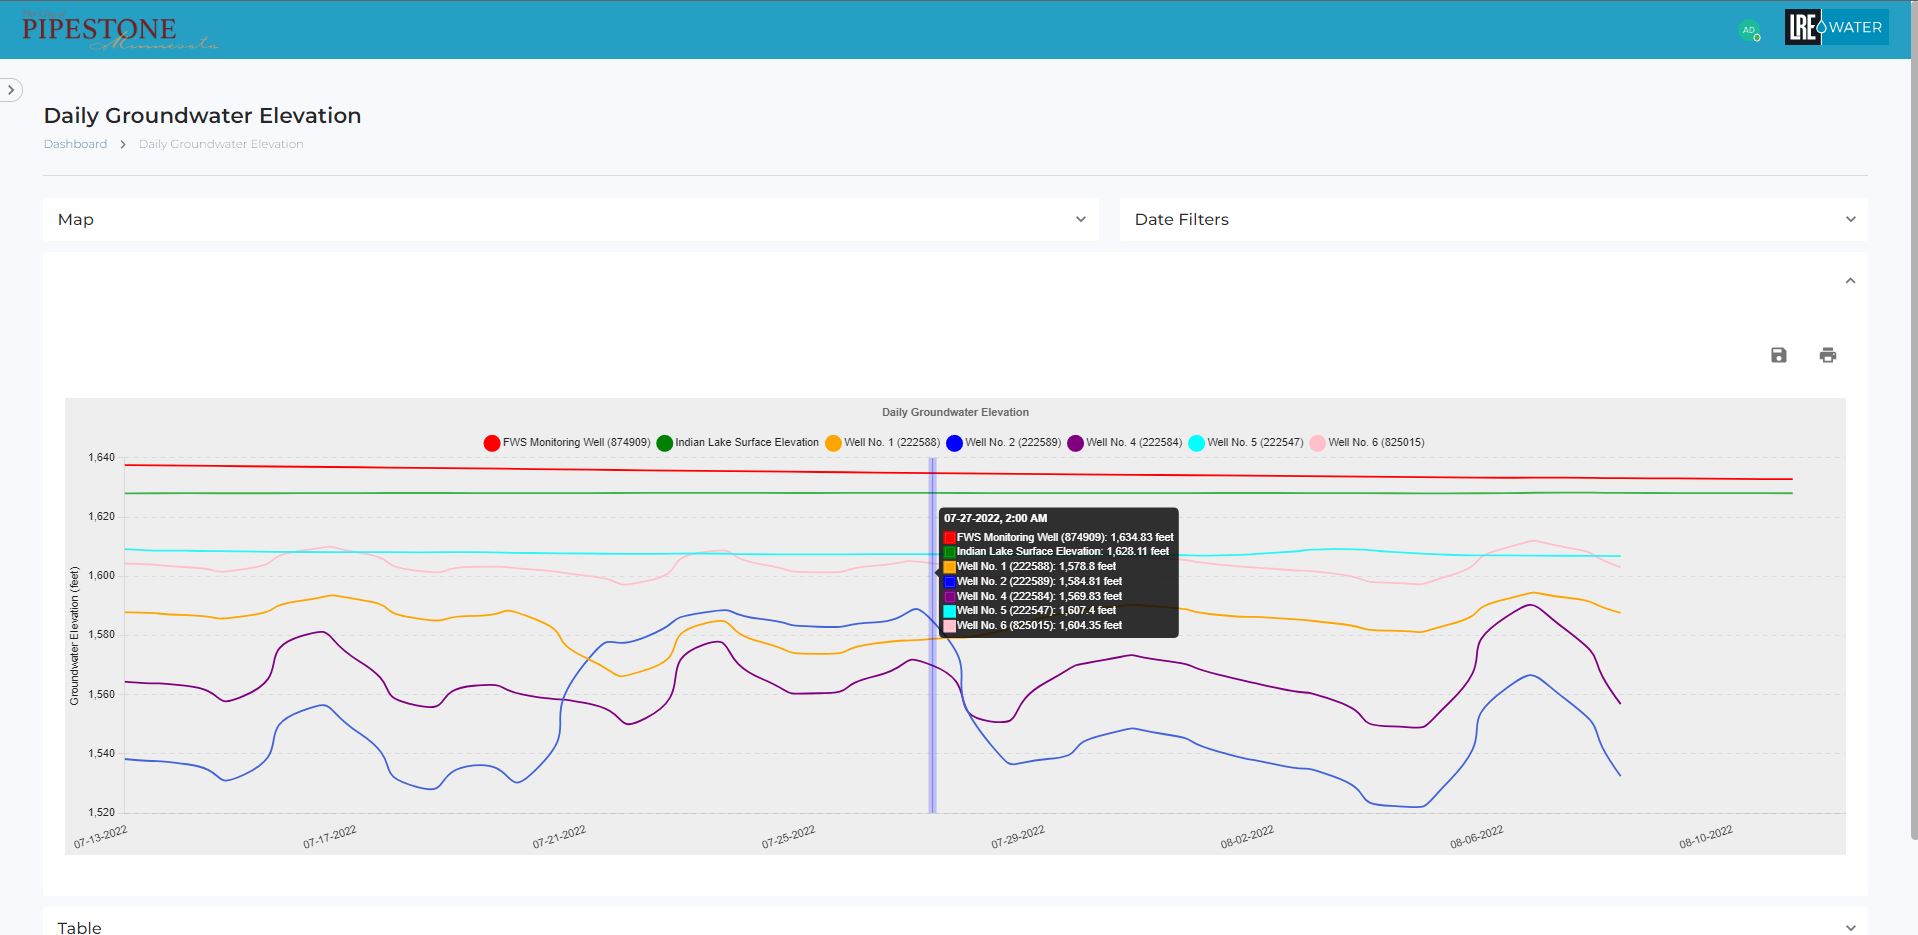
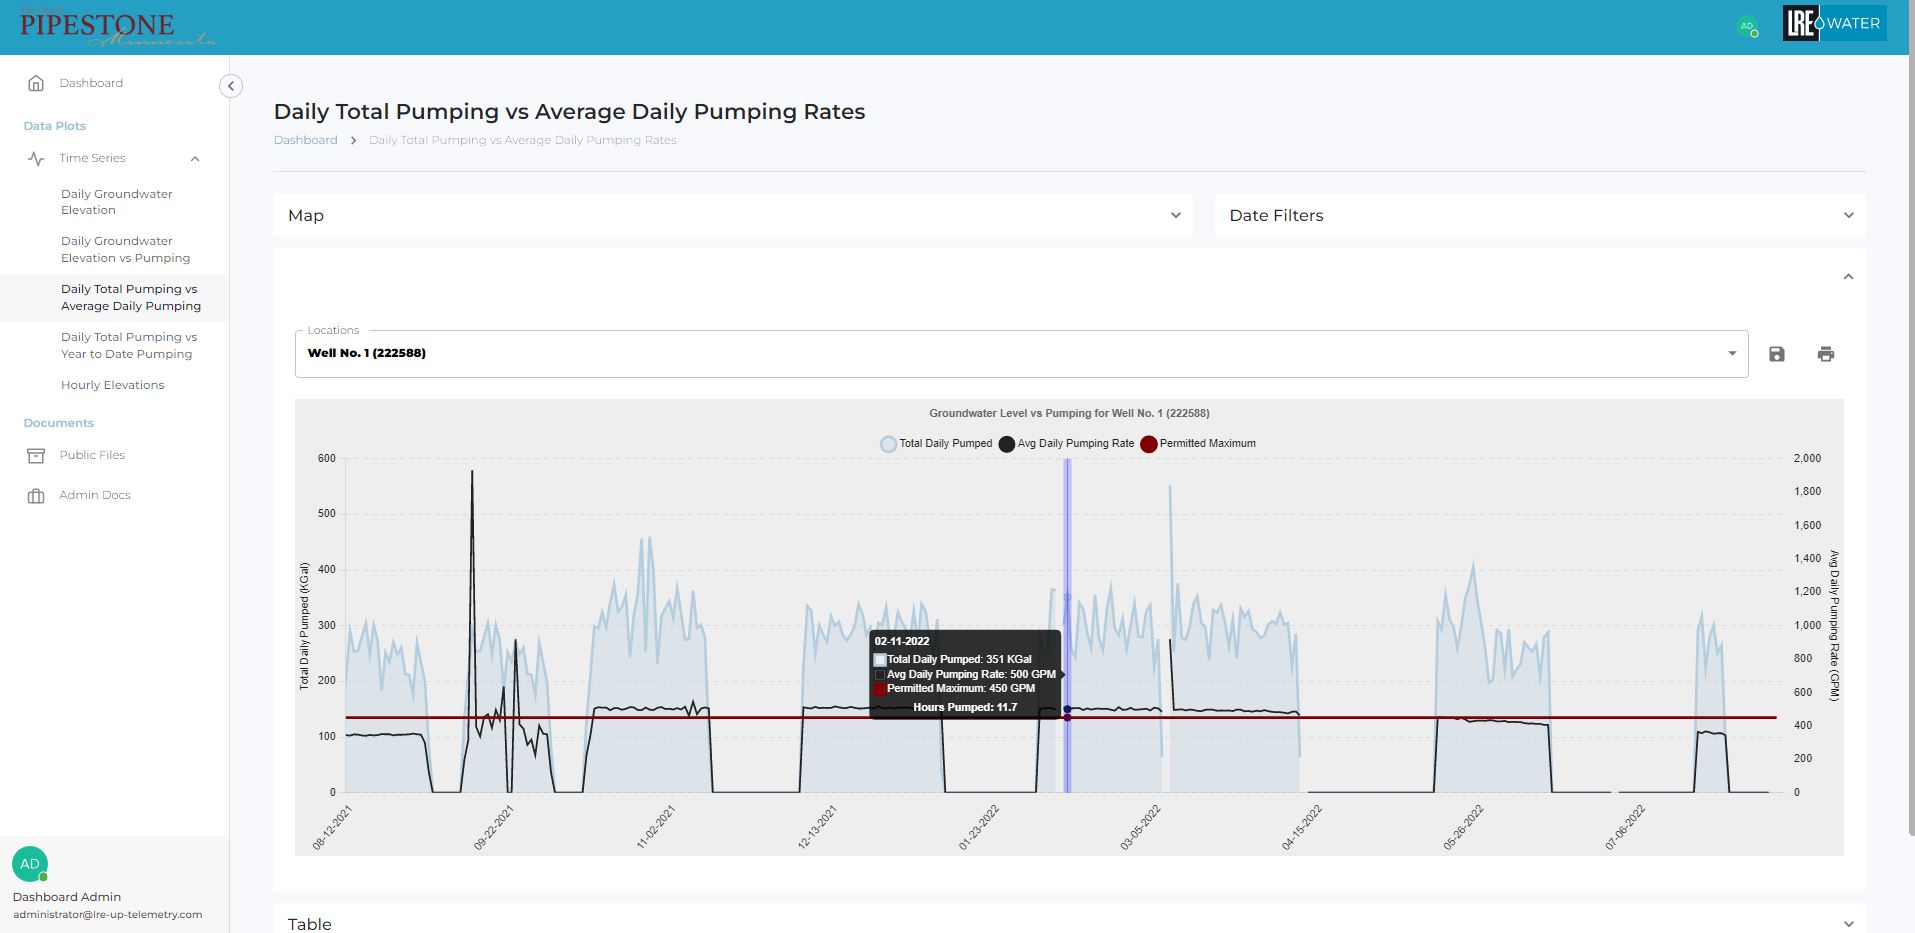
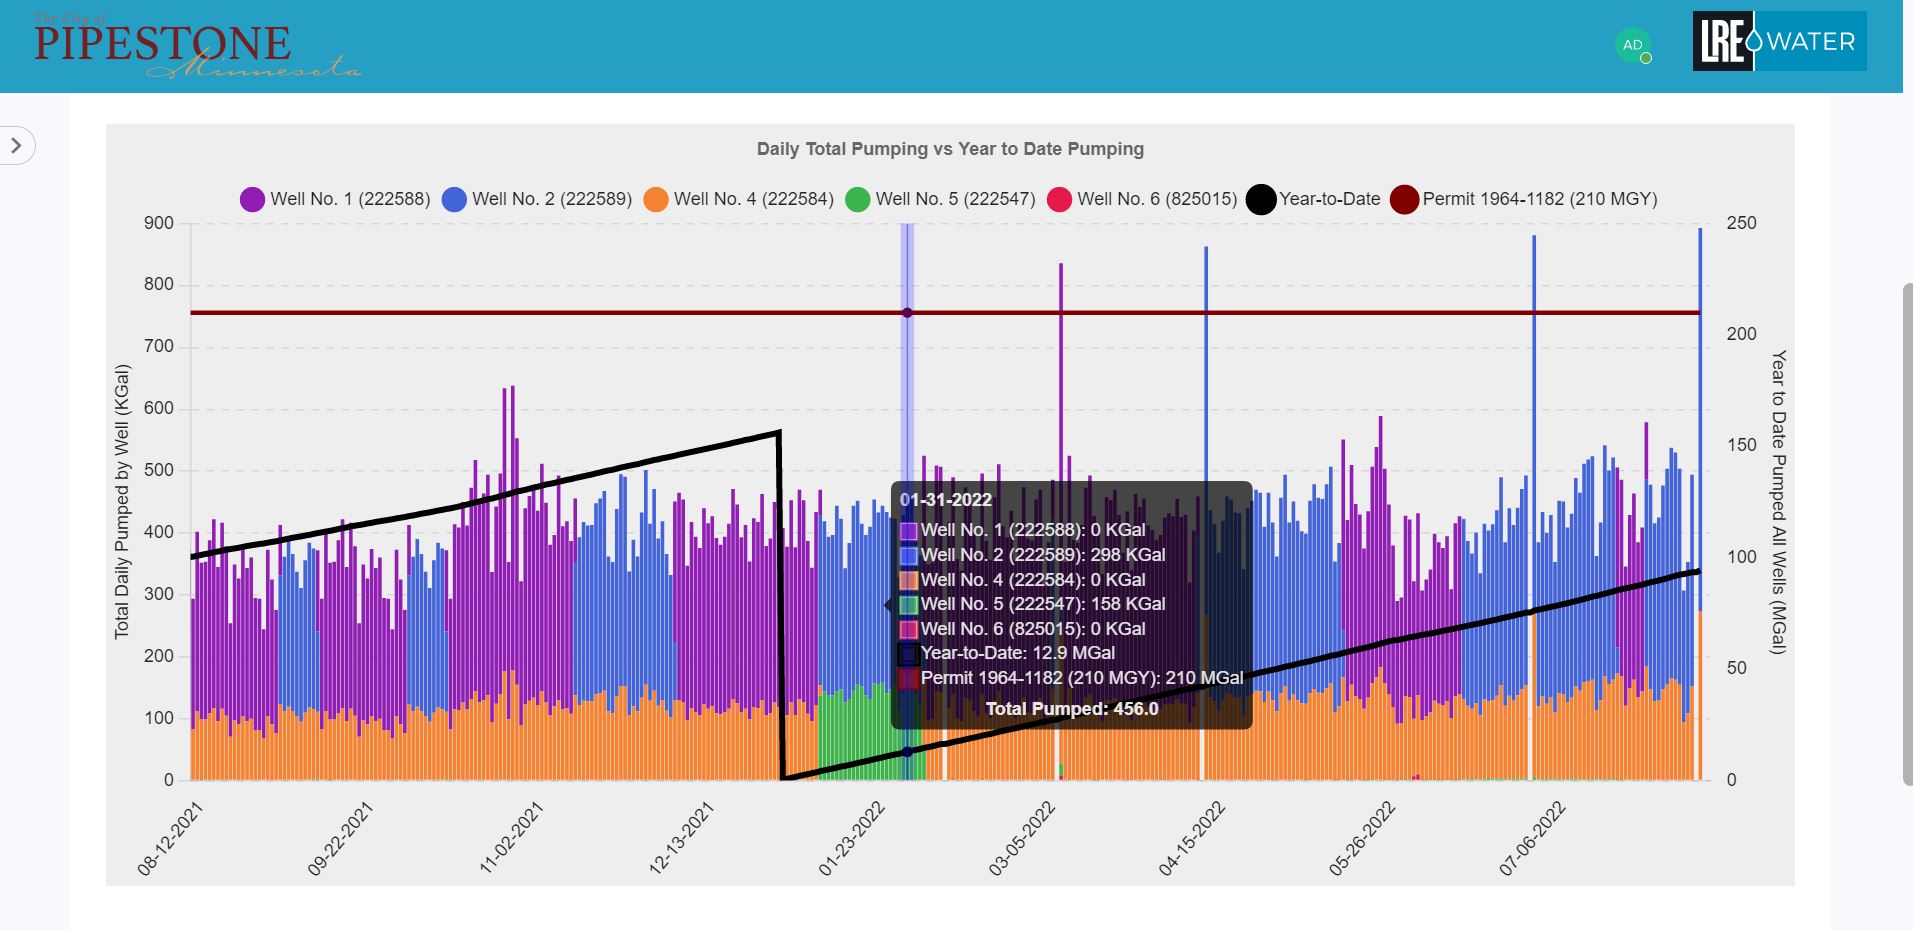
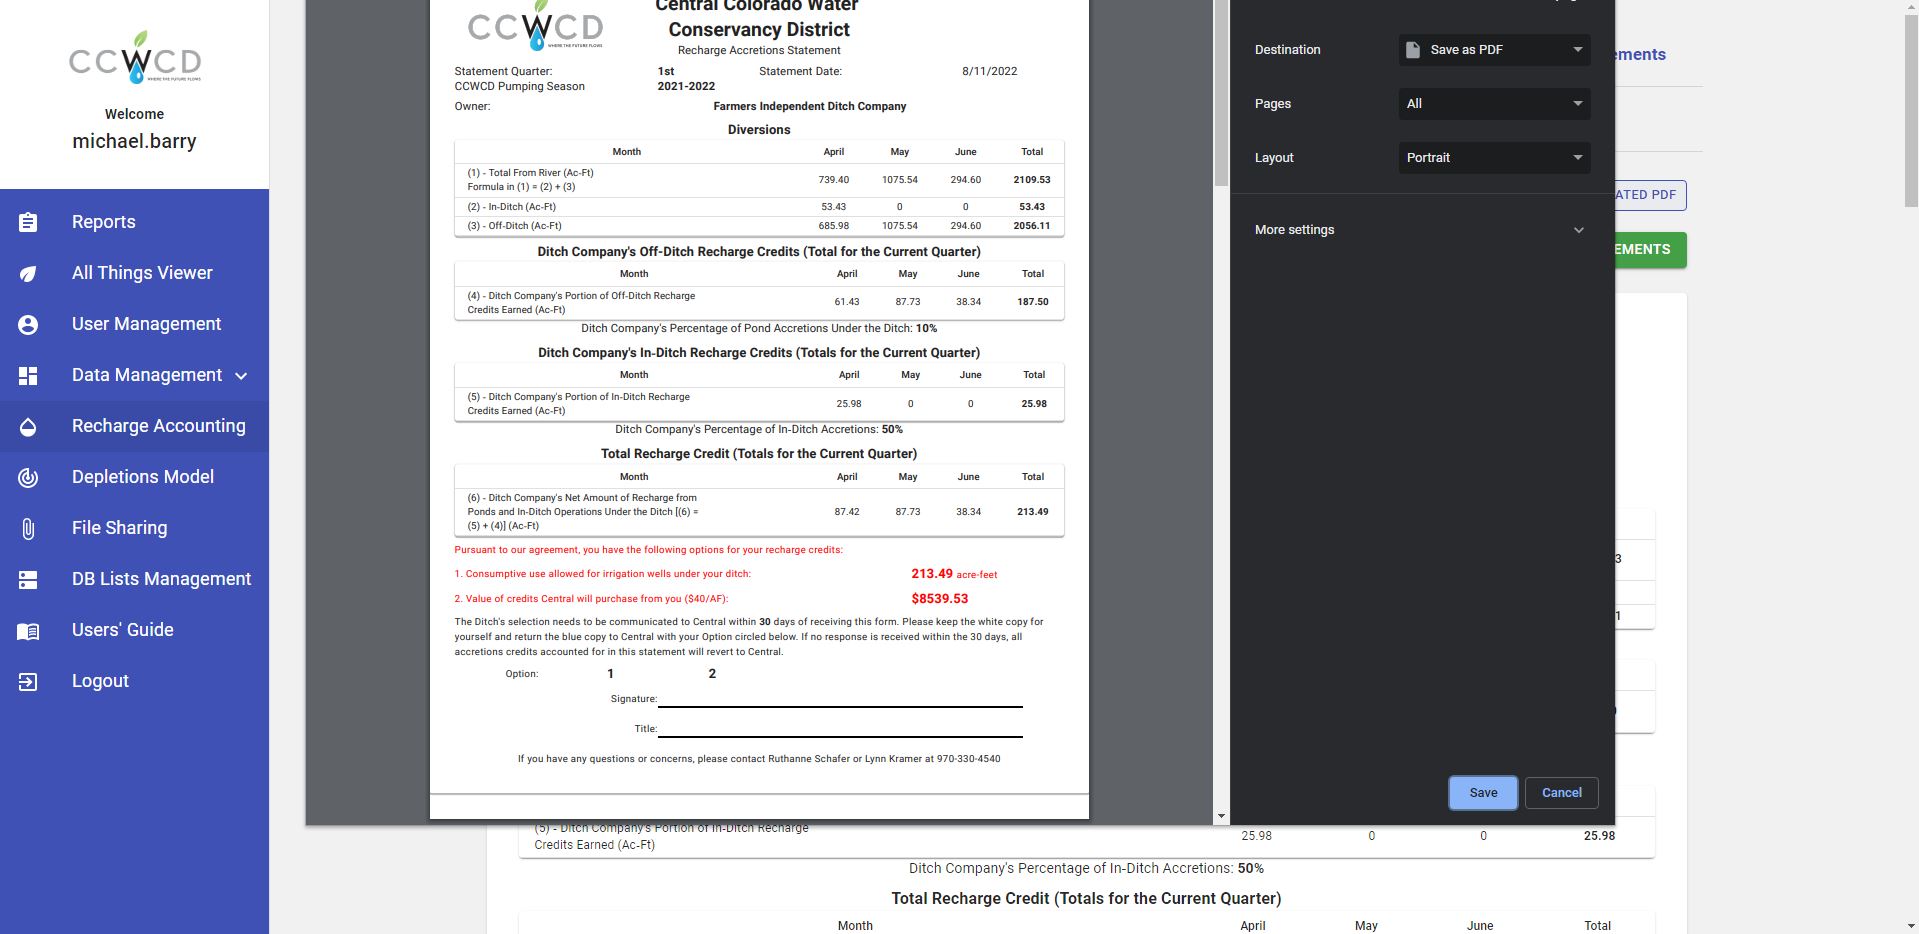
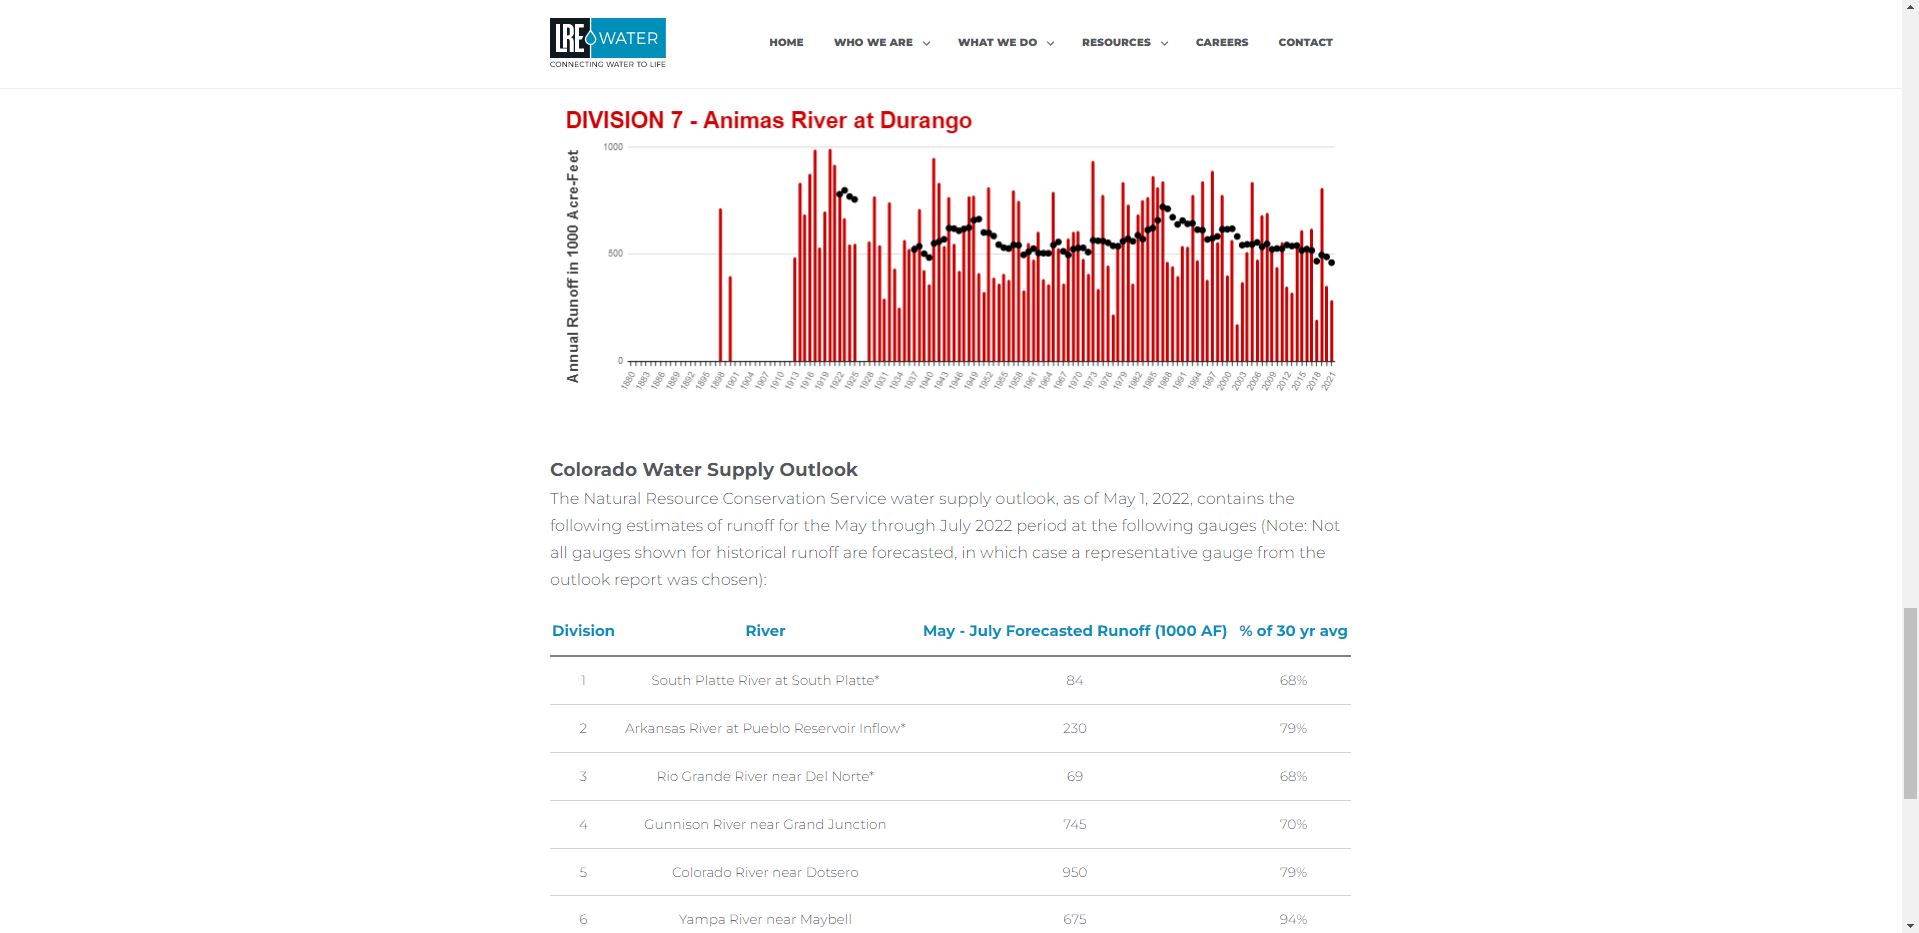
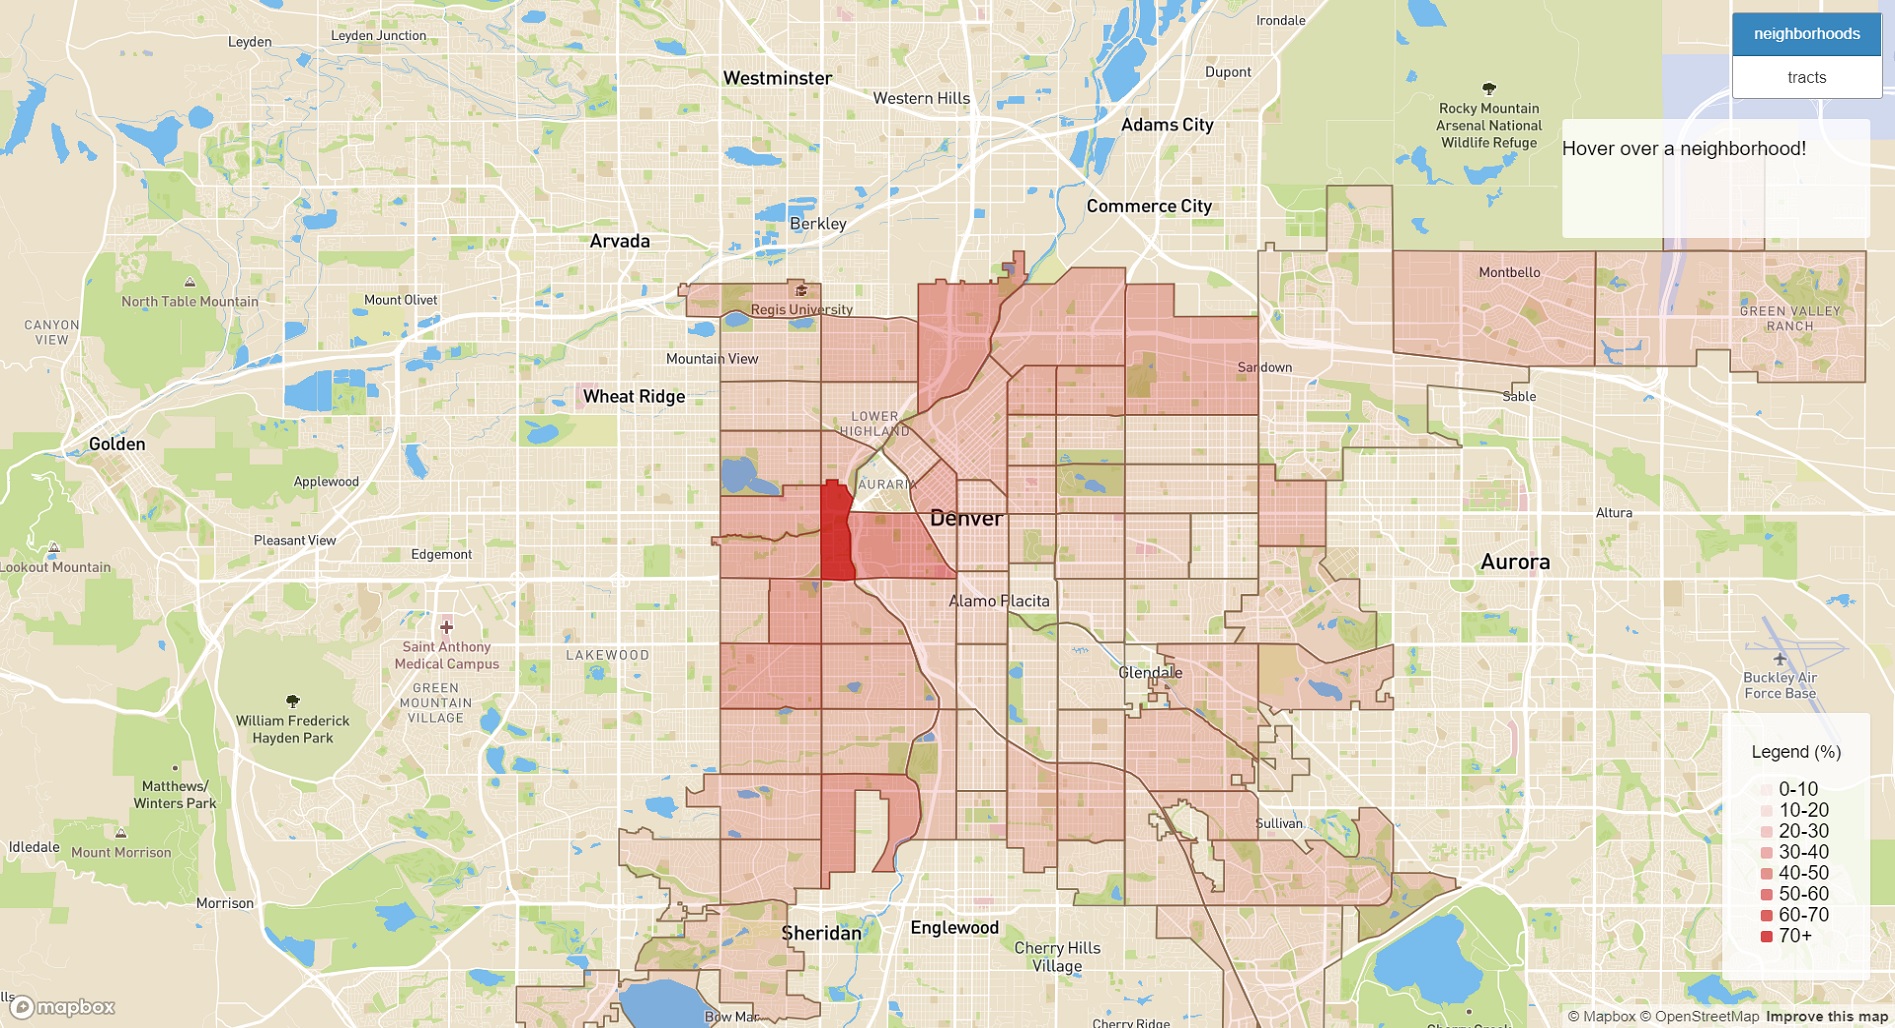
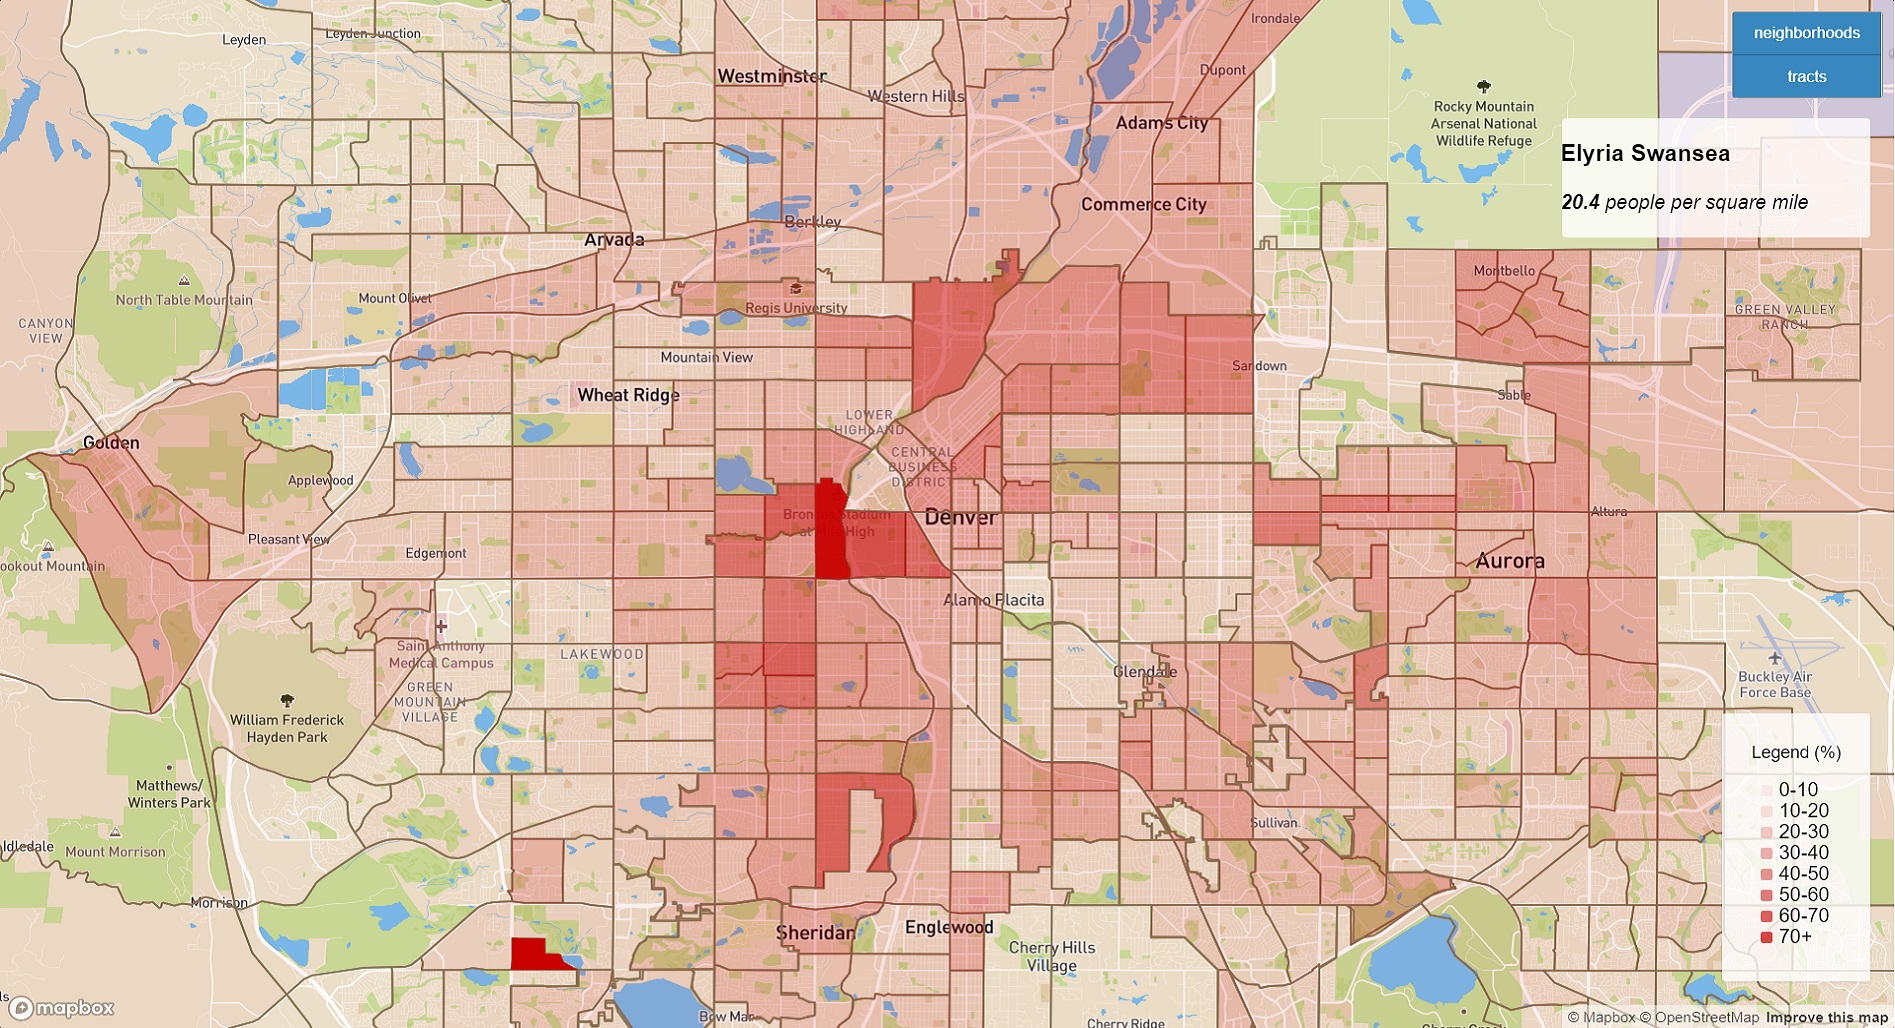
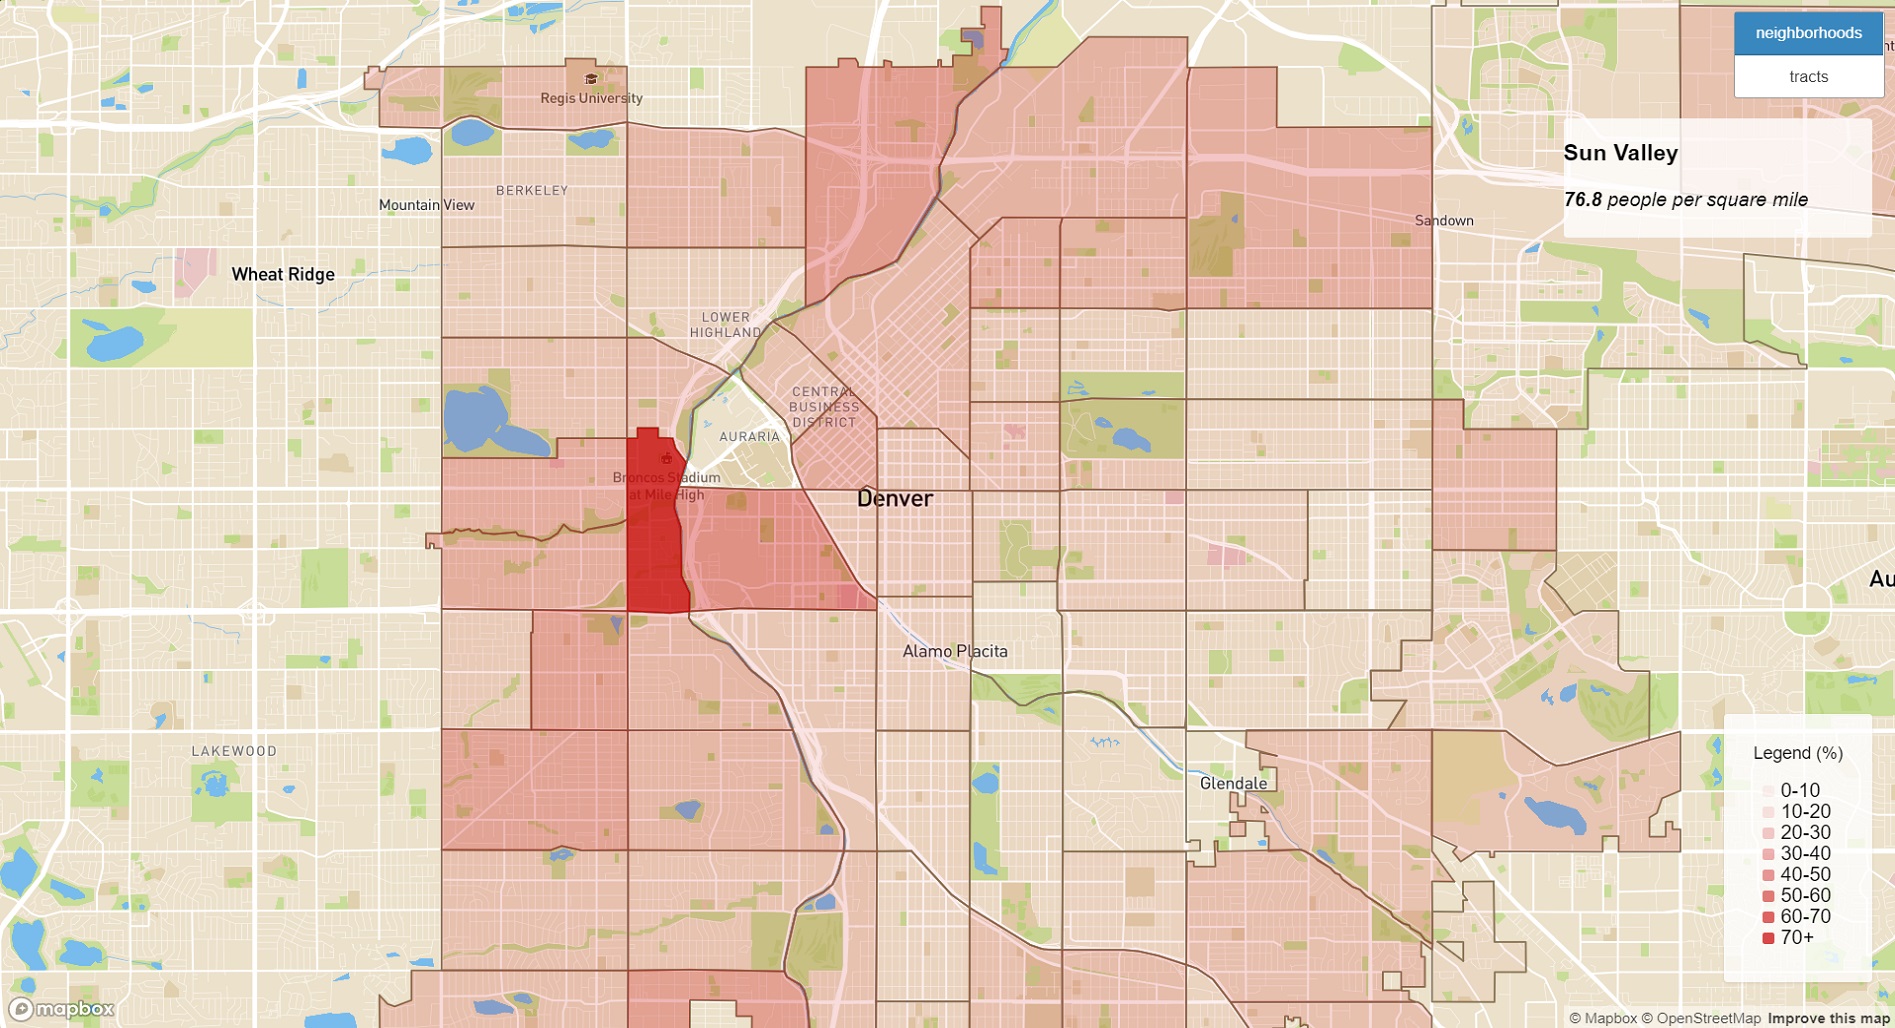
At LRE Water, I'm the lead web developer creating fast and user-friendly interfaces with advanced data management, analysis, and visualization capabilities. As the sole in-house developer, I'm intricately involved in every phase of application development, from conception to support, managing over 40 legacy projects and introducing over 20 new ones.
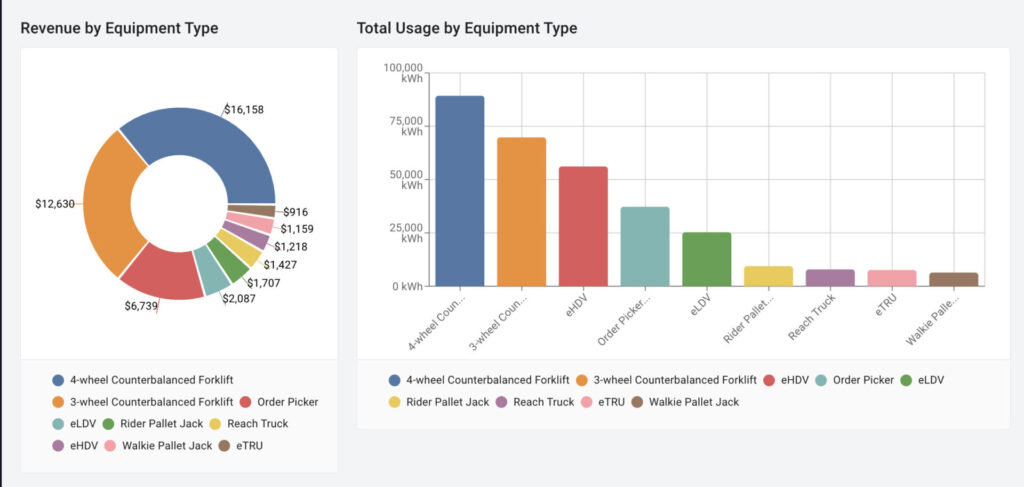
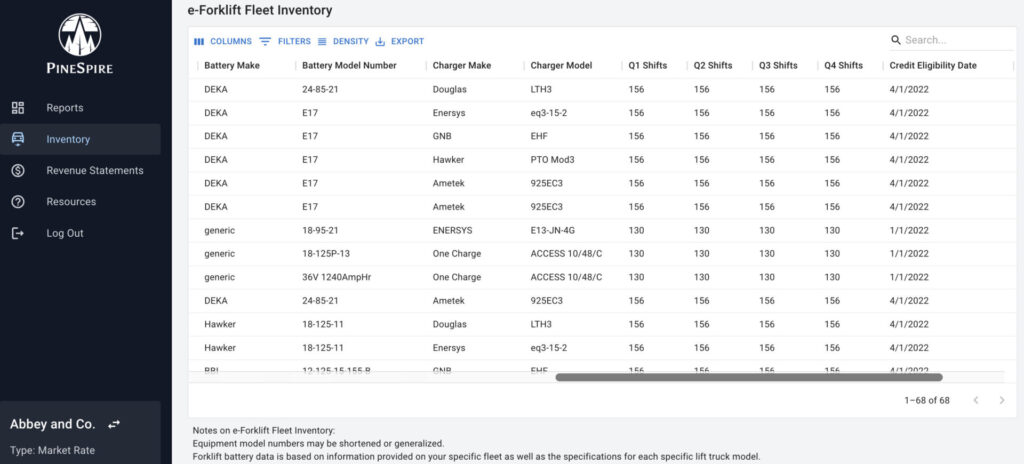
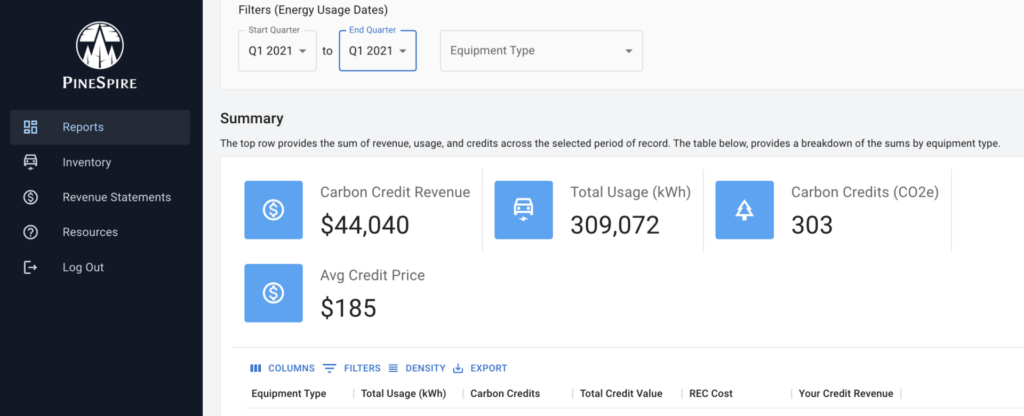
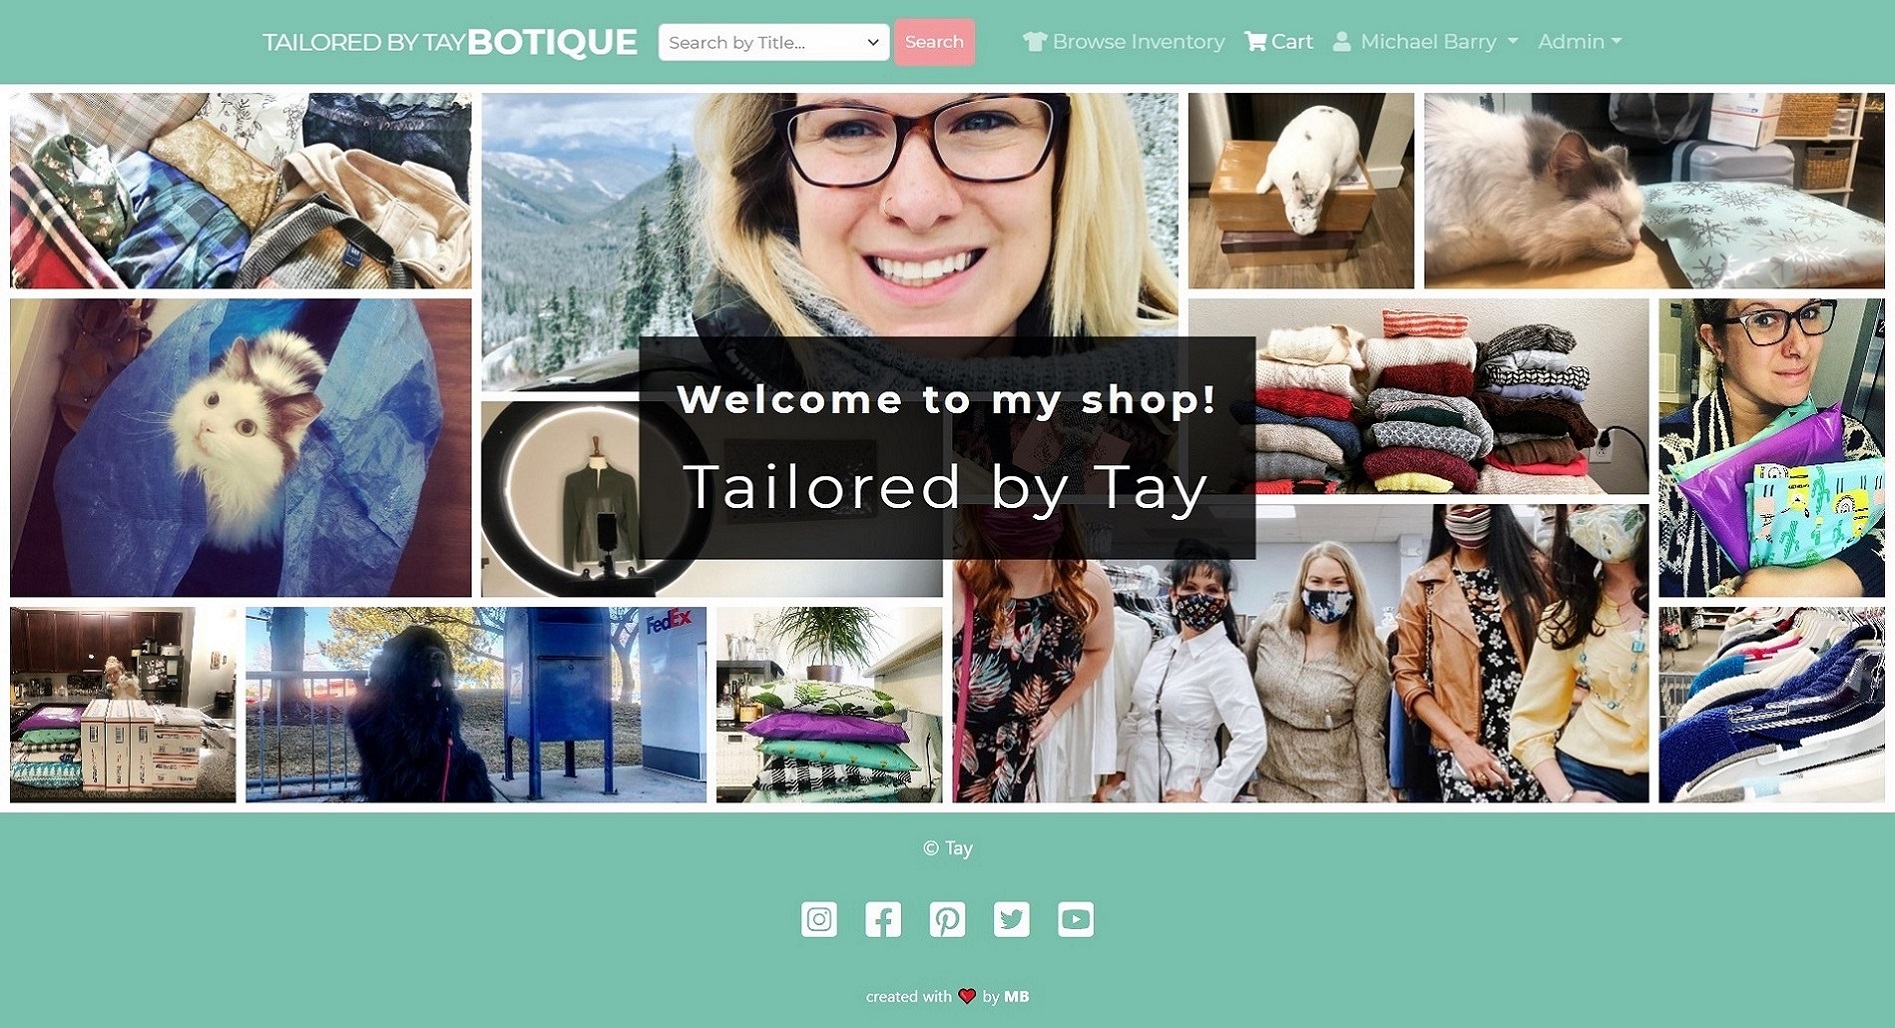
In 2022, I founded Michael Barry Web Development, a venture that began with a collaboration on a PS2 Platform for PineSpire. My role involved significant contributions to the UI of their Electrification Platform.
My background also includes a rich and diverse experience in the restaurant industry, having managed high-volume units in Disney World, fine-dining establishments in Boston, a vibrant tapas bar, and a 16-venue food hall in Denver through the challenges of the Covid-19 pandemic.
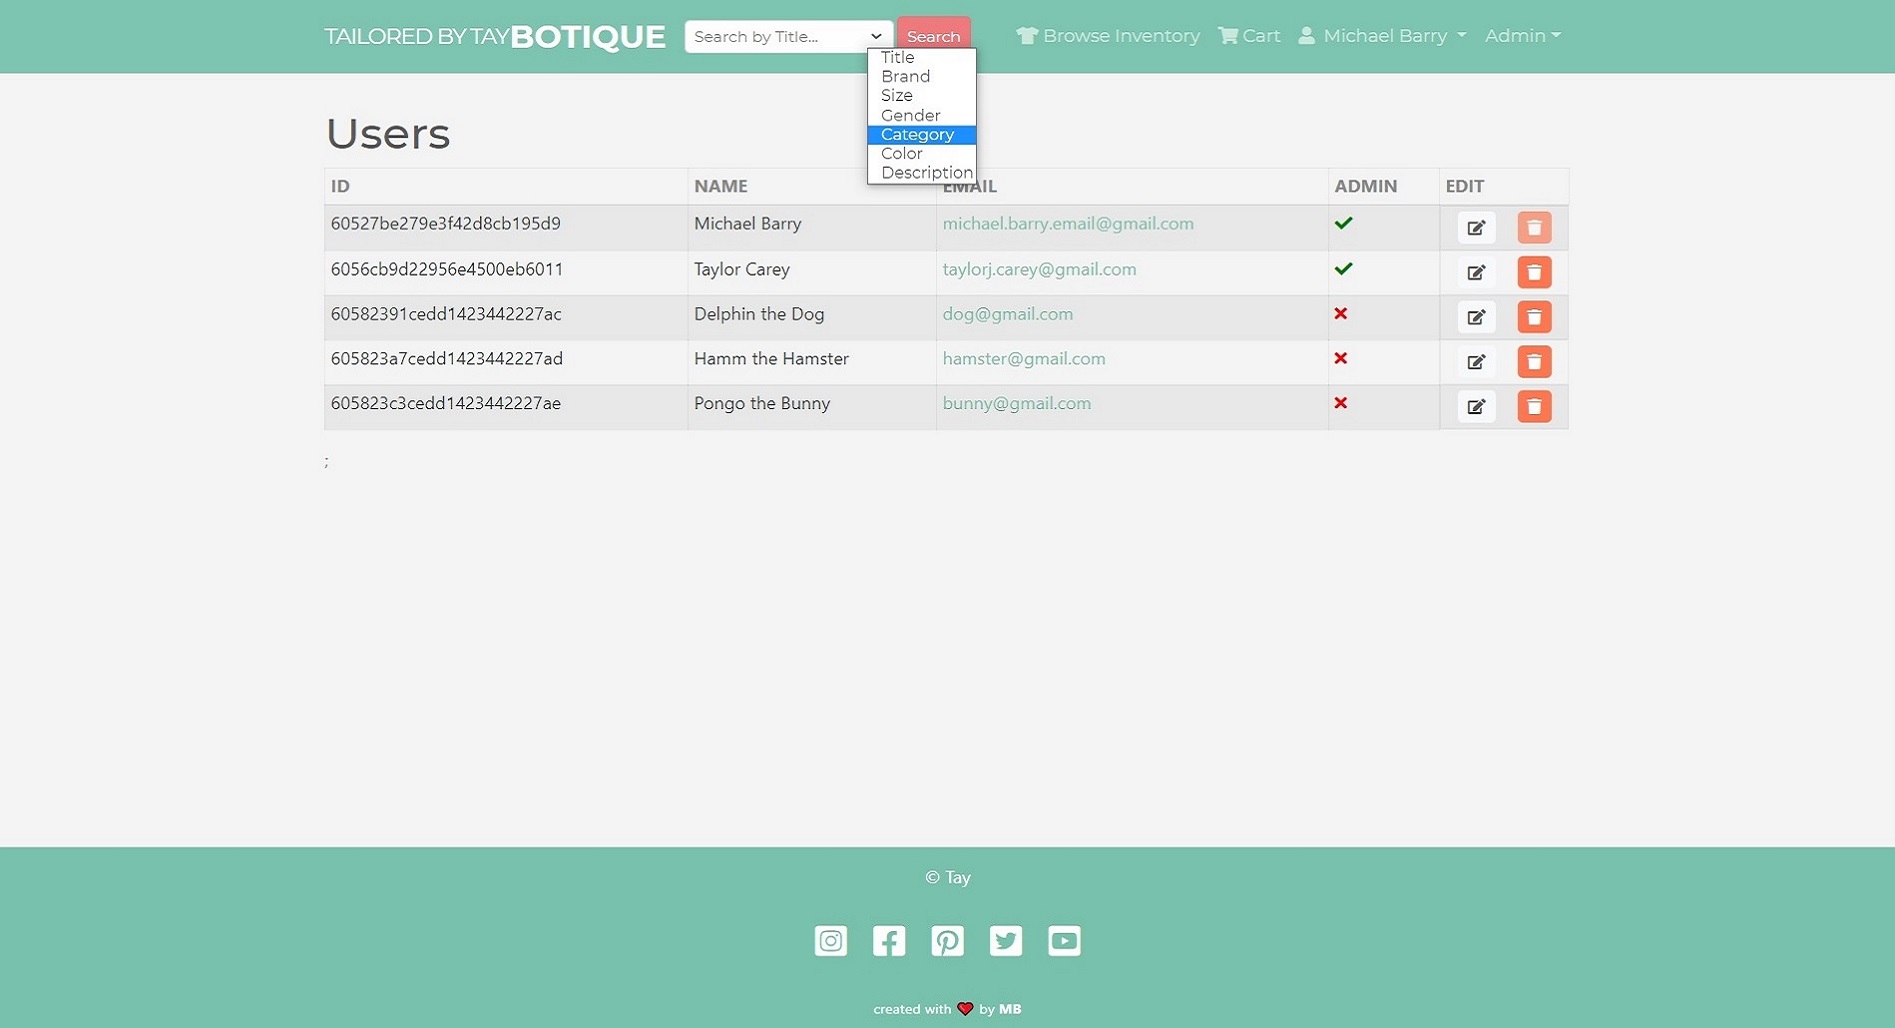
Outside of programming, I'm an avid cook, CrossFit competitor, explorer of Maine's natural beauty, strategy board game enthusiast, and a dedicated family man to my fiancée Taylor, our daughter Evie, and our beloved pets Delphin 🐶, Elsa 🐺, Eddy 🐱, and Pongo 🐰.
View Resume